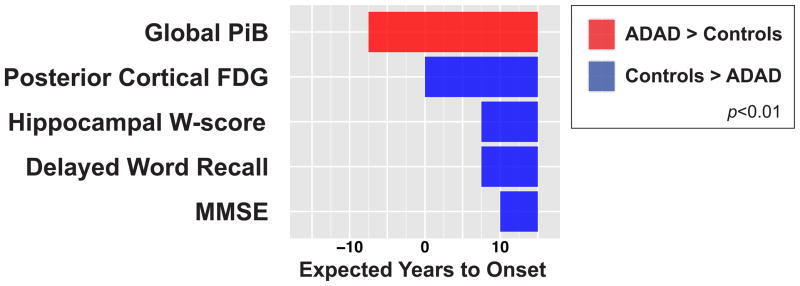
Figure 3. Comparison between ADAD and Stage-0 older controls.

We compared the mixed model estimates for the neuroimaging and clinical markers in ADAD to cross-section data from “Stage-0” older controls who were selected to have normal PiB, FDG, age-corrected hippocampal W-score and cognition. Significant (p<0·01) increases in ADAD are indicated in red while significant decreases are indicated in blue.
