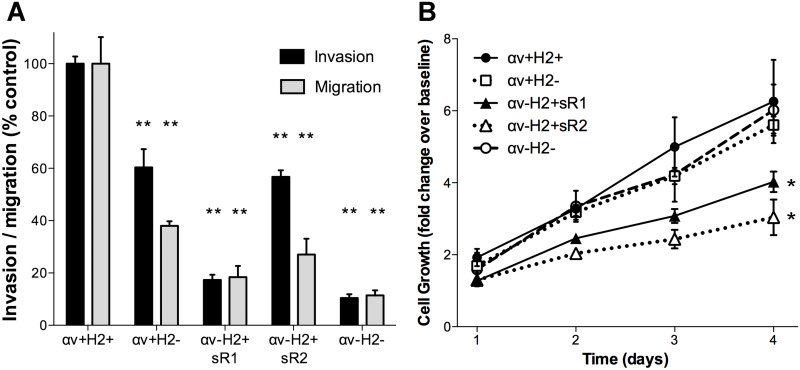
Fig 5. In vitro cell migration and proliferation of breast cancer cell clones.
(A) The motility of MM2BH cell lines was examined in transwell assays in the absence (migration, 8h) and presence of Matrigel extracellular matrix (invasion, 64h) using FBS as chemoattractant. The graph represents average motility from six replicates from independent experiments. Bars show mean ± SEM. (B) Cell proliferation was measured every 24h with the Cell-Titer Glo luminescence assay. The graph shows average fold increase from eight replicate wells from separate experiments. Data are presented as mean ± SEM, *P<0.05, ** P<0.001 in comparison to control cells.

