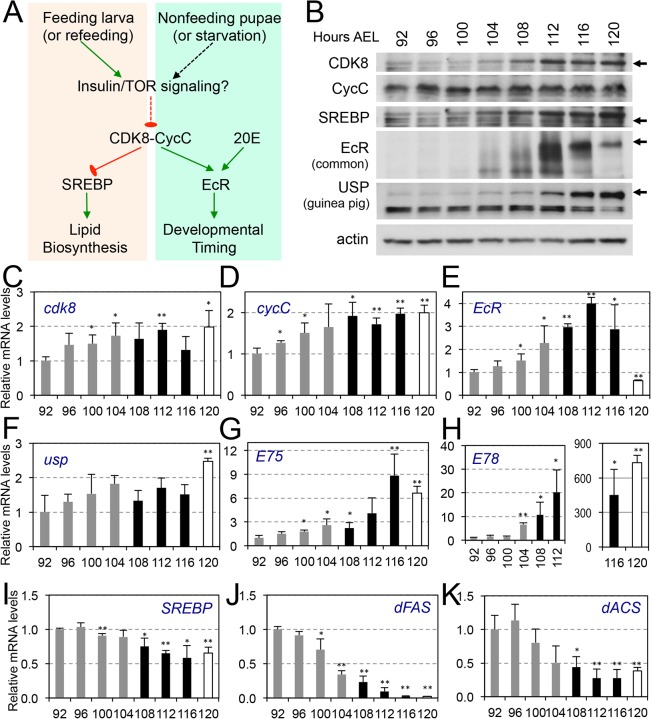
Fig 7. CDK8-CycC may couple nutrient intake, lipid biosynthesis, and developmental timing.
(A) Model for the CDK8-SREBP/EcR regulatory network: In response to nutrient intake, CDK8-CycC may coordinately regulate lipogenesis by directly inhibiting SREBP-activated gene expression and developmental timing by activating EcR-activated gene expression during the larval–pupal transition. Arrows represent activation, and blunt arrows represent inhibition. (B) The protein levels of CDK8, CycC, SREBP, EcR-B1 and USP (upper band is the 54 kDa full-length USP) in wild-type larvae from L3 (92 hr AEL) to the WPP stage (120 hr AEL). For SREBP, the lower band (approximately 49 kDa, arrow) is the mature nuclear form, while the upper band (53–54 kDa) is the N-terminal fragment of SREBP after cleavage by the S1P (see S5B and S5C Fig for detailed analyses of these SREBP isoforms). (C–K) The mRNA levels of cdk8, cycC, EcR, usp, E75, E78, SREBP, dFAS, and dACS from L3 (92 hr AEL) to the WPP stage (120 hr AEL). The black bars represent the wandering stage, while the white bars represent the WPP stage. The x-axis represents the number of hours AEL. * p < 0.05; ** p < 0.01 based on t-tests. Underlying numerical data and statistical analysis for Fig 7C, 7D, 7E, 7F, 7G, 7H, 7I, 7J, and 7K can be found in S1 Data.

