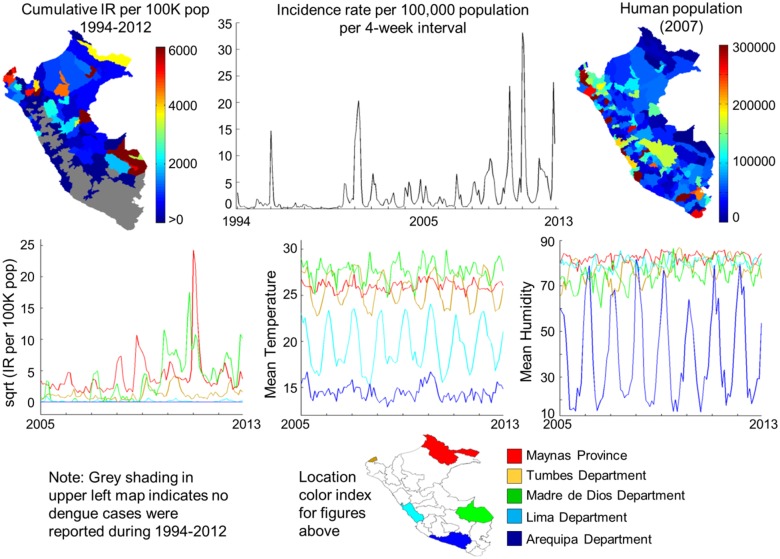
Fig 1. Heterogeneity in human population, dengue cases, and weather dynamics across Peru.
Top left: Cumulative dengue incidence rates per province, 1994–2012, across Peru. Grey indicates areas with no reported dengue cases. Top center: Time series of reported dengue incidence rate for Peru is shown for 1994–2012. Top right: Human population per province across Peru, 2007. Lower left: Time series of dengue incidence rates per week, 2005–2012, are shown for 5 areas of Peru with widely varying levels of transmission. Bottom center and right: Mean temperature and mean humidity time series for the same 5 areas illustrating the spatial diversity of weather patterns across Peru. A color index map is shown at the bottom of the figure to identify the location associated with each time series in the second row of panels. Time series for weather conditions are averaged over the designated province/department by 4-week time periods. Time series for dengue represent the total incidence rate per designated province/department by 4-week time periods.

