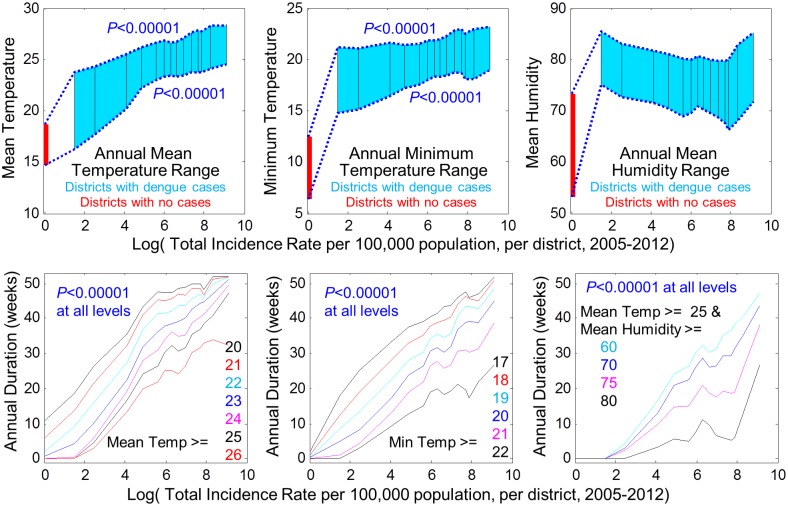
Fig 3. Relationship between weather and dengue incidence magnitude across districts.
Top row: Annual temperature and humidity ranges are shown versus district incidence rates, 2005–2012. Mean weather ranges are shown for dengue-negative districts and by percentile groups in 5% increments for dengue-positive districts. P-values represent tests of association between weather range and incidence per district. Bottom row: Relationship between incidence and minimum annual duration above specific temperatures is shown in left/center panels. Bottom right: For mean temperature >25°C, as humidity rises from 60% to 80%, incidence rates accelerate in highest transmission areas, p<0.00001.

