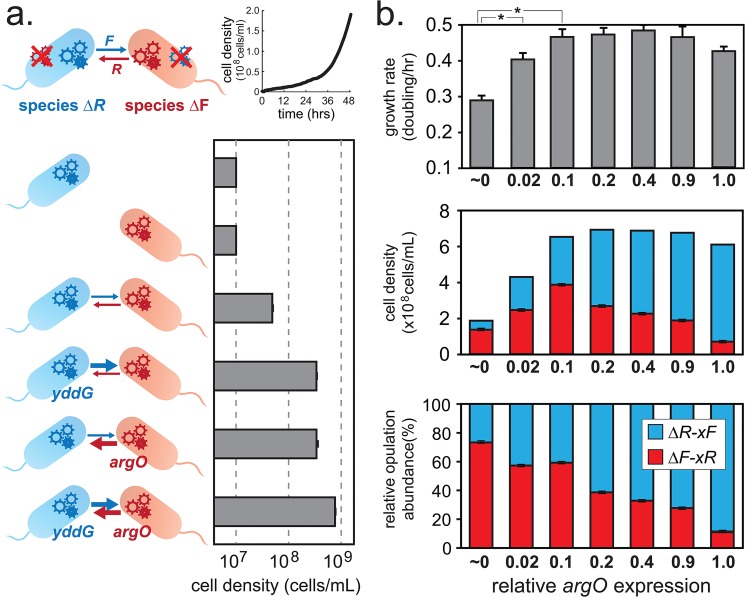
Fig 6. Experimental measurement of growth-abundance tradeoffs.
All data are averages from experiments in biological replicates (n = 3). (a) Auxotrophic E. coli strains ∆R and ∆F grow by exchange of metabolites arginine R and phenylalanine F in a co-culture (black growth curve). Bar graph shows 24-hr population density of co-culture variants with R and F amino acid exporters argO and yddG respectively. (b) Growth rate, 24-hr cell density, and population ratio (top, middle, bottom panels) of co-cultures of ∆R-xF and ∆F-xR where argO expression is increased on a relative scale of 0 to 1. Asterisks highlight statistical significance (p<0.001 by t-test). Error bars indicate standard deviations of data acquired in biological replicates (n = 3).

