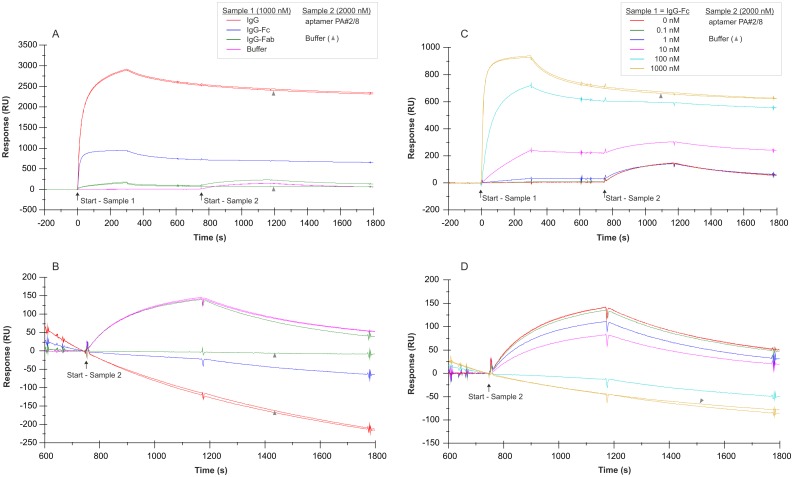
Fig 12. SPR interaction analyses regarding the aptamer binding site in Protein A.
Biacore X100 / sensor chip CAP / ligand: biotinylated Protein A with immobilization level of ~560 RU / two-step analyte binding without regeneration in between, (A-B) analyte 1 = sample 1: human IgG, IgG-Fc fragment, IgG-Fab fragment with a concentration of 1000 nM each, or buffer, (C-D) analyte 1 = sample 1: concentration series of human IgG-Fc in the range of 0–1000 nM, (A-D) analyte 2 = sample 2: 2000 nM 5’-fluorescein-labeled aptamer PA#2/8 or buffer. Double-referenced sensorgrams are shown (blank reference surface without Protein A, buffer injection). Binding of sample 1 followed by sample 2 is shown in (A) and (C) with alignment to injection start of sample 1. In (B) and (D) only binding of sample 2 with alignment to injection start of sample 2 is shown.

