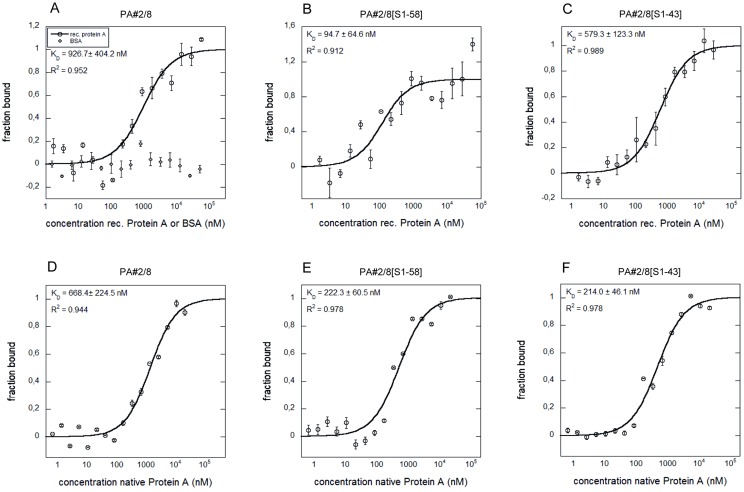
Fig 13. Aptamer—Protein A interactions analyzed by MST.
Binding curves for the interactions of fluorescently labeled aptamer PA#2/8 (A, D) or its truncated variants PA#2/8[S1-58] (B, E) and PA#2/8[S1-43] (C, F) with recombinant or native Protein A are shown. BSA was used as negative control (A). The aptamer concentration was kept constant at 50 nM for each interaction analysis and the protein was titrated in the range from 1.69 to 55,555 nM of recombinant Protein A and from 0.33 to 10,820 nM of native Protein A, respectively. The binding data were fitted, and the dissociation constants (K D) were calculated.

