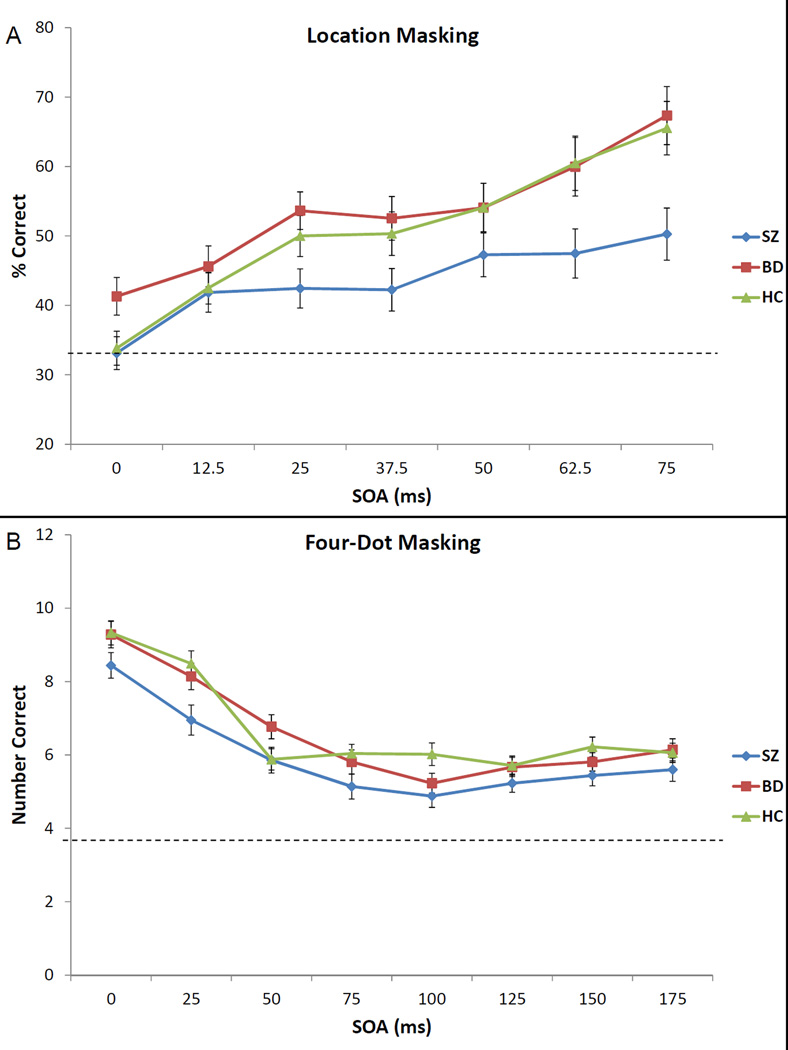
Figure 3.
Performance of the bipolar group (in red), schizophrenia group (in blue), and healthy control group (in green) on the RSVP dual target task, using the conditional probability of correct T2 identification given correct T1 identification (A) and the suppression ratio (B). The bars represent standard errors.

