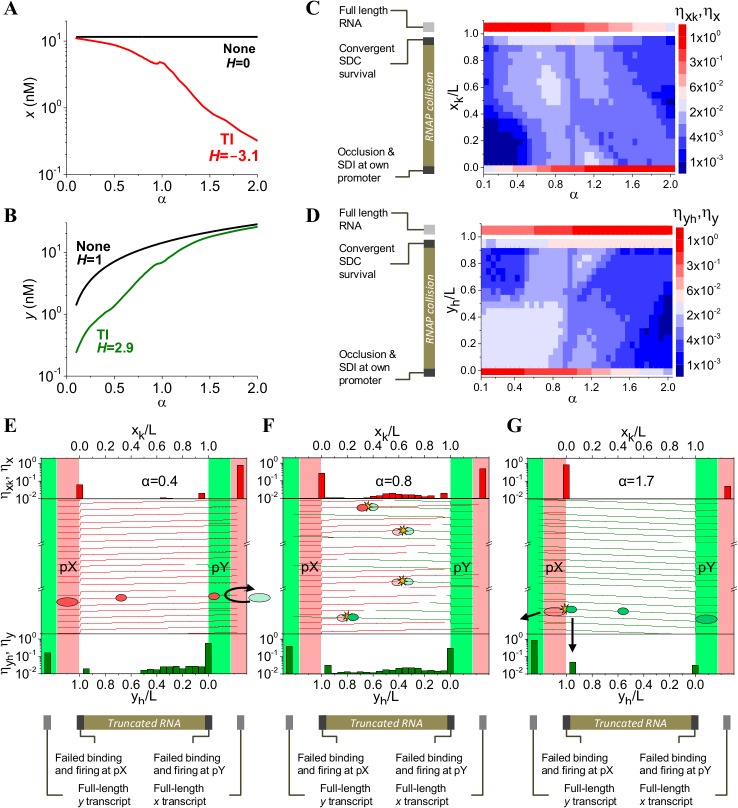
Fig 3. TI gives rise to a switch-like response.
(A, B) Reciprocal switch in expression of full-length x transcript level (A) and full-length y transcript level (B). x and y expression is inversely correlated, while x levels decrease as α increases, y levels increase. H denotes the value of Hill coefficient (see Methods) (C, D) Expression maps for full-length (η x, η y) and truncated () transcripts from pX (C) and pY (D) respectively. Fraction of rounds of transcription which failed to fire (due to occlusion or sitting duck interference, SDI) are depicted at positions x k/L = 0 and y h/L = 0. Production of truncated RNA transcripts due to survival of SDCs at pY and pX promoter is represented at positions x k/L = 0.95 and y h/L = 0.95, respectively. Fraction of successful full-length transcripts (η x, η y) appears at positions x k/L>1 and y h/L>1. (E) Mechanistic representation of occlusion at pY for α = 0.4. Middle panel shows representative trajectories of ECs along the DNA when occlusion at pY is the dominant mechanism. Horizontal green dashed lined at pY region (middle panel) indicate rounds of transcription that were occluded. Top and bottom panels show transcriptional fraction of full-length (η x, η y) and truncated RNA transcripts () originated at pX (top panel) and pY (bottom panel), respectively. Fraction of rounds of transcription which failed to fire (due to occlusion or sitting duck interference) are depicted at positions x k/L = 0 (top panel) and y h/L = 0 (bottom panel). (F, G) Analogous representations showing RNAP collision for α = 0.8 (F) and SDI at pX for α = 1.7 (G) as the dominant mechanism, respectively. For E, F, and G panels, opaque ellipses represent RNAPs that continued transcribing after TI occurred while translucent ellipses denote RNAPs that were not able to bind or remain bound to DNA. The simulations shown in panels A-G correspond to L = 400 bp, τBX = 20 s, τIX = 12 s and τIY = 9.5 s, and α values varied from 0.1 to 2 by varying τBY from 2 to 40 s. Initiation time always remained smaller than binding times in order to avoid self-occlusion.

