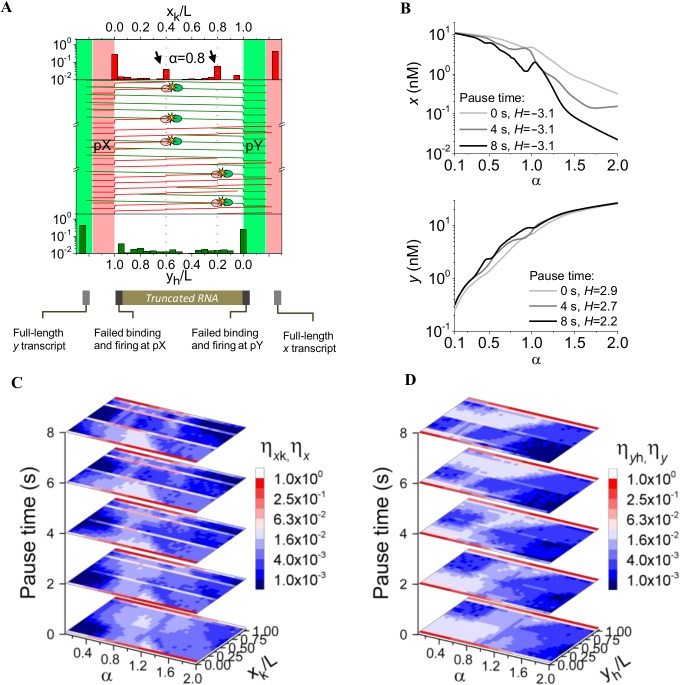
Fig 4. TI in the presence of RNAP pause sites.
(A) Mechanistic representation of RNAP collision in presence of two pause sites in the sense strand at positions 160 bp (xk/L = 0.4) and 320 bp (xk/L = 0.8). Pause times are 2 s. Increased production of truncated RNA at the pause sites due to enhanced probability of collision is indicated by arrows. (B) Switch response in x levels maintains sharpness as pause time increases but the dynamic range of x is widened more than one order of magnitude. H denotes the value of Hill coefficient (see Methods). (C) Expression maps for truncated and full-length RNA from pX at different pause times. Truncated RNA production increases as pause time increases. (D) Expression maps for truncated and full-length RNA from pY at different pause times.

