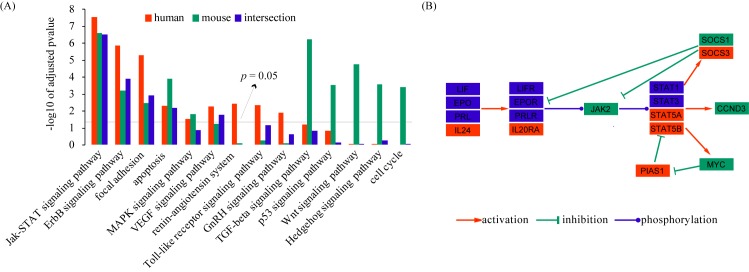
Fig 3. Pathway enrichment analysis of decidualization-related genes.
(A) The figure shows the significantly enriched pathways identified by using DAVID online tools. The bars represent the enrichment p-value at logarithmic scale. (B) Visualization of the LIF-STAT signaling pathway. Nodes represent genes. The node color indicates the status of the gene as specific to human (red), specific to mouse (green), or shared by both (blue). Edges represent gene dependences derived from KEGG pathway database. Genes without a direct interaction with others are not included. This graph is generated using the Cytoscape software.

