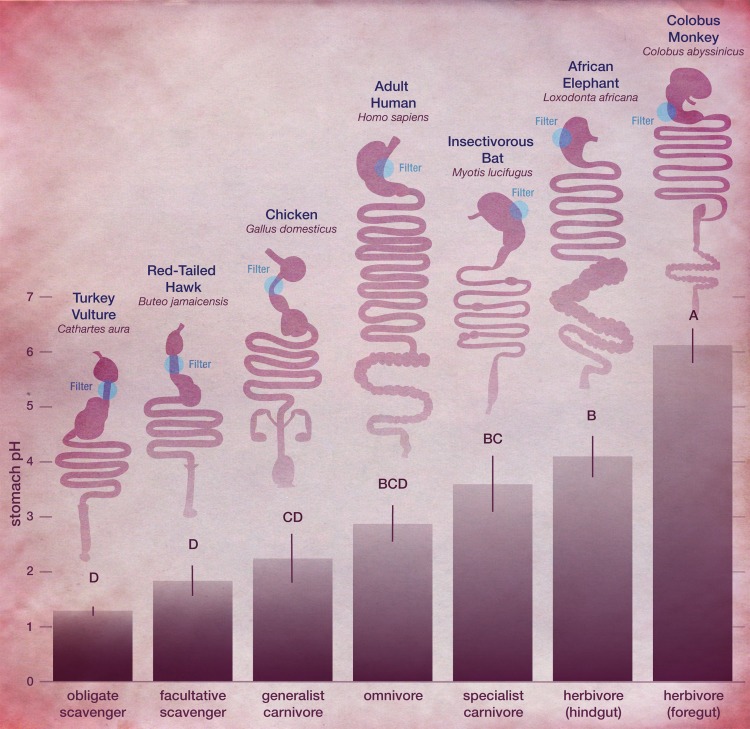
Fig 1. Comparison of stomach pH (mean ± S.E.) across trophic groups with gastrointestinal tracts of representative birds and mammals.
Different letters above error bars represent statistically significant differences (P < 0.05) using ANOVA and Tukey-Kramer post-hoc test. Obligate scavengers (1.3 ± 0.08), facultative scavengers (1.8 ± 0.27), generalist carnivore (2.2 ± 0.44), omnivore (2.9 ± 0.33), specialist carnivore (3.6 ± 0.51), hindgut herbivore (4.1 ± 0.38) and foregut herbivore (6.1 ± 0.31).

