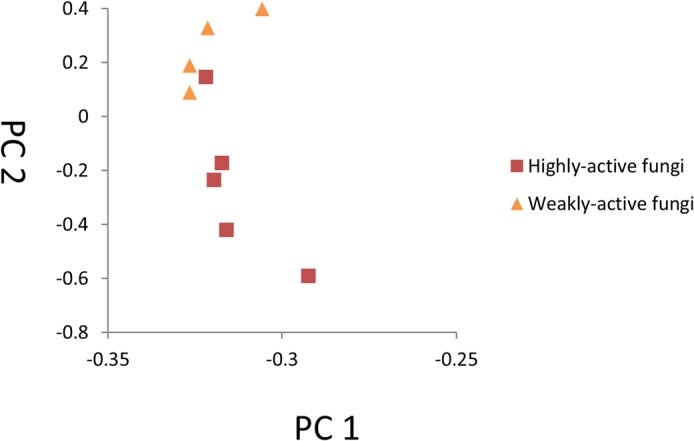
Fig 1. Principal component analysis (PCA) of poplar genes during infection.

The graph illustrates the distribution of each sample in the space of the first two principal components (PCs). The samples infected with weakly active fungi are clustered together, whereas the distribution of the highly active group is relatively scattered.
