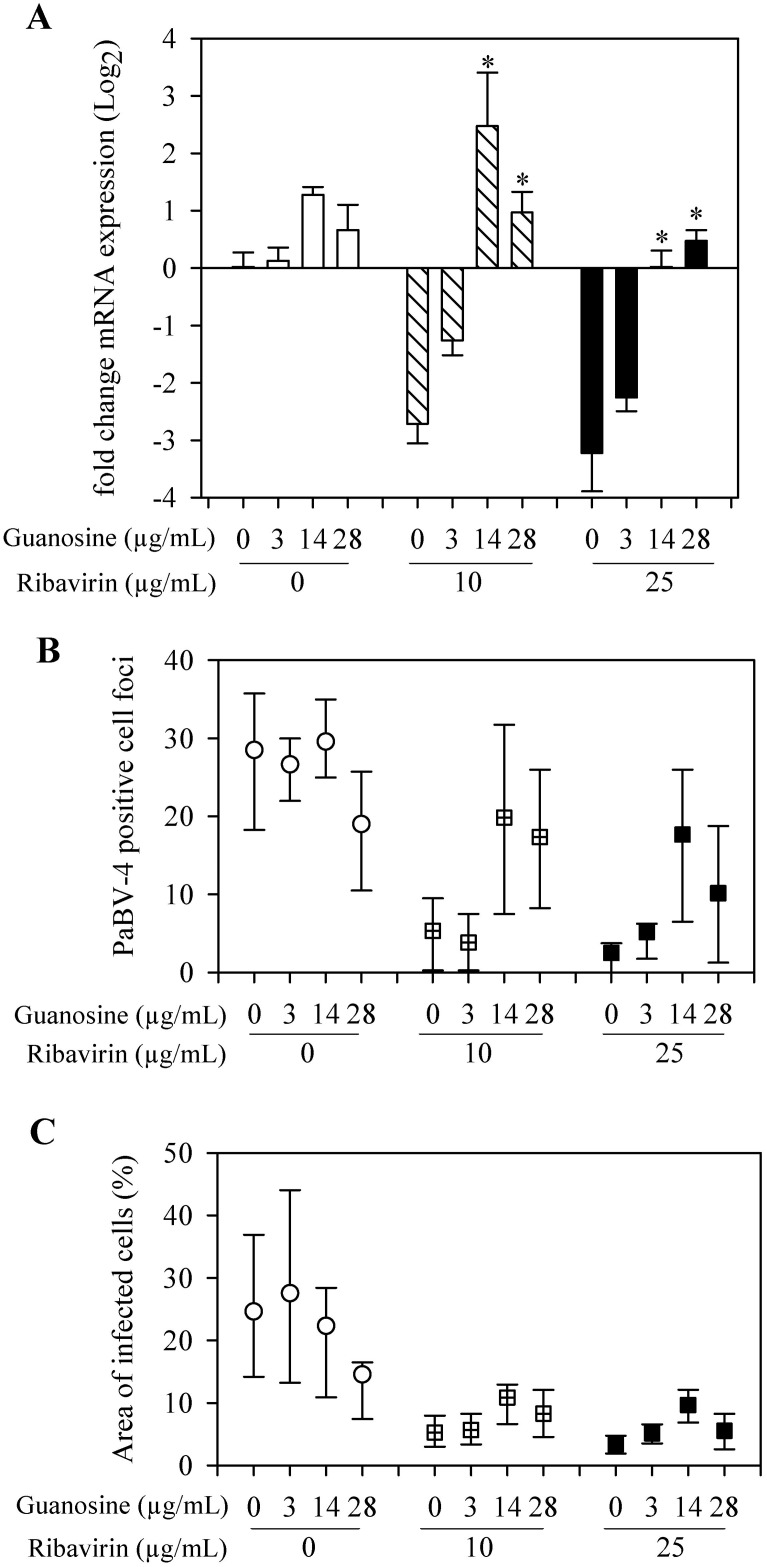
Fig 6. Guanosine inhibition of ribavirin antiviral activity on PaBV-4.
(A) qRT-PCR results reported as mean (±SD) relative change in P gene mRNA expression, compared to control group (neither guanosine nor ribavirin added). *, compared with no guanosine within ribavirin treatment group (P <0.05, ANOVA with Holm-Sidak method). (B) Indirect immunocytochemistry results presented as median ± 25th and 75th percentiles positive stained cell foci. (C) Indirect immunocytochemistry results presented as median ± 25th and 75th percentiles of the percentage area of infected cells.

