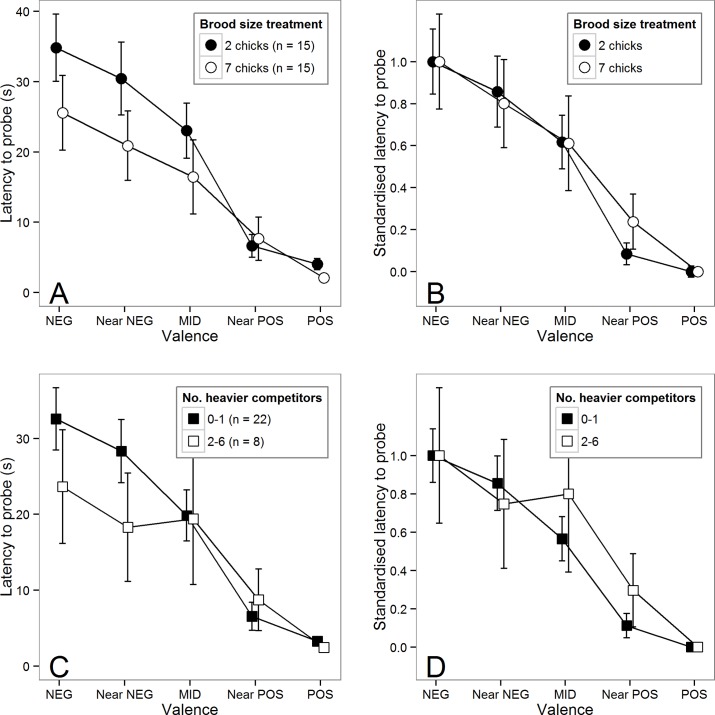
Fig 1. Effects of developmental competition on judgment bias.
(A) Latency to probe as a function of stimulus valence for birds in the two brood-size treatments. Data are mean ± 1 s.e. latency to probe in the cognitive bias test trials. (B) The same data shown in panel A standardised so that the latencies to probe POS and NEG are 0 and 1 respectively. This standardisation removes differences in speed to probe POS and NEG between treatments, and hence reveals the differences in the shapes of the generalisation gradients between treatments. Note that this standardisation is for visualisation purposes only and was not used in the data analysis (see text for details). (C) Latency to probe as a function of stimulus valence for birds at the top of the weight hierarchy in the nest (0 or 1 heavier competitors) and birds at the bottom of the weight hierarchy (2–6 heavier competitors). Data are mean ± 1 se latency to probe in the cognitive bias test trials. The dichotomization of the data into the groups 0–1 and 2–6, is for visualisation purposes only; all statistical analyses were conducted using the number of heavier competitors as a continuous predictor variable. (D) The same data shown in panel C standardised so that the latencies to probe POS and NEG are 0 and 1 respectively. Note that the standard errors shown on all of the plots in this figure give a false impression (underestimate) of the significant differences between the groups due to the fact that birds from the same genetic family are present in both treatment groups.

