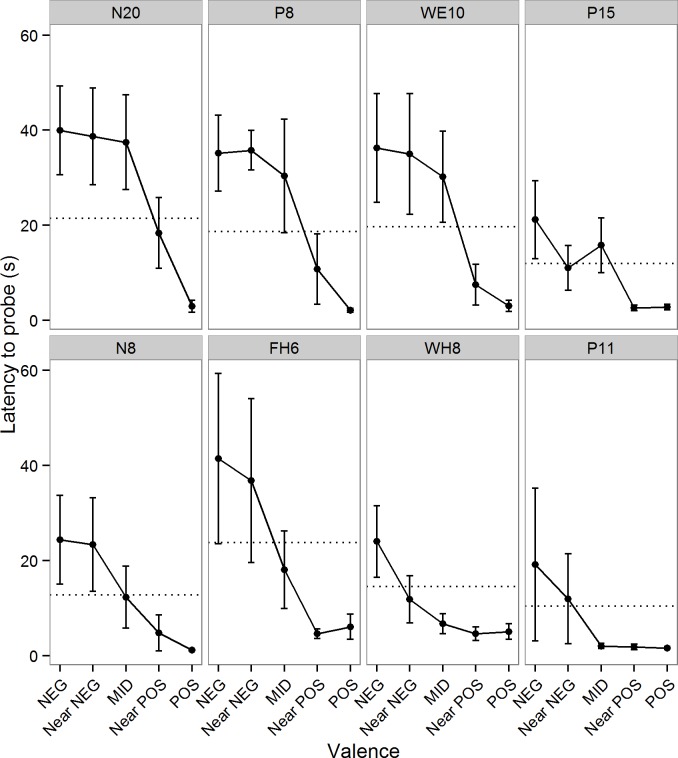
Fig 3. Effects of genetic family on judgment bias.
Latency to probe as a function of stimulus valence for each of the 8 genetic families. Families FH6 and P11 contained 3 birds and the other families contained 4 birds. Data are mean ± 1 s.e. latency to probe in the judgment bias test trials. The dotted lines show the mean speed for each family (the mean of the mean latencies to probe POS and NEG). The top row of families were ‘pessimists’, meaning that their mean latencies to probe ambiguous stimuli were predominantly greater than the mean speed and more similar to NEG, whereas the bottom row were ‘optimists’, meaning that their mean latencies to probe ambiguous stimuli were predominantly less than the mean speed and more similar to POS.

