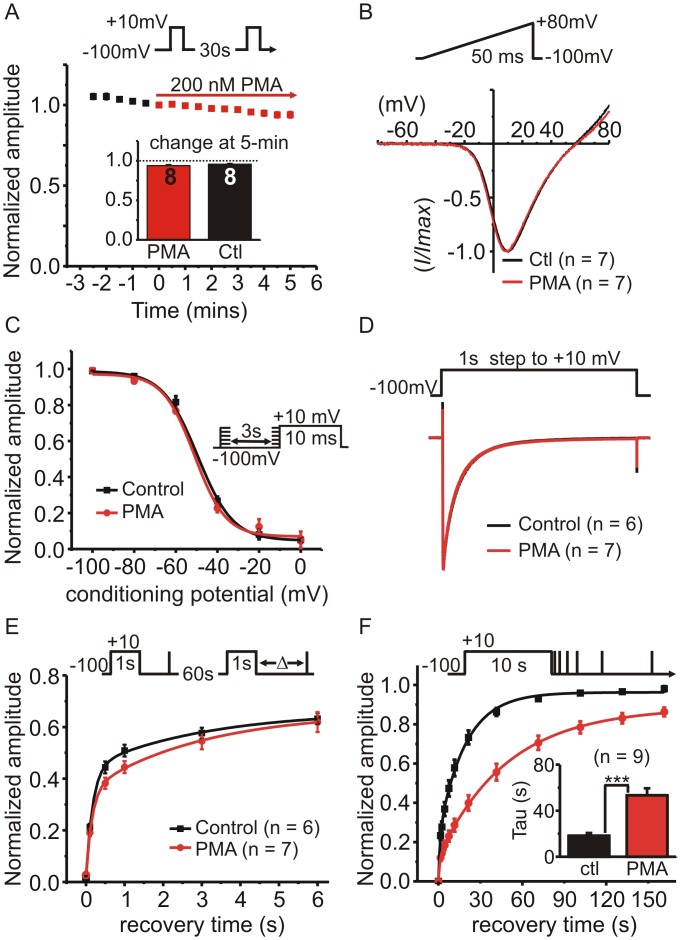
Fig 1. Phorbol ester (PMA) selectively targets recovery from “slow” inactivation.
The effects of acute application of PMA on HEK293 cells expressing CaV2.2, β1b and α2δ were investigated. (A) Cells were stimulated with a 10ms step depolarization and peak amplitude of I Ba plotted against time (normalized to the time point immediately before PMA application) (n = 8; error bars are plotted but in most cases fall within the symbol so are not visible). The inset bar graph shows the change in I Ba amplitude after 5-minutes of PMA (200 nM) was not different from time-matched control cells. (B) Shows the normalized current-voltage relationship of I Ba evoked by a ramp depolarization first in the absence (Ctl) then in the presence of PMA (200 nM for 5-min). Traces are the mean values (n = 7) and error bars are omitted for clarity. (C) The voltage-dependence of closed-state inactivation was determined before and during application of PMA (protocol shown in the inset). The mean normalized current amplitude was plotted and fit with a Boltzmann function of the form: I = I2 + (I1 —I2) / 1 + e((V—V50)/k)). The two curves (control and PMA) were not significantly different from one another (F = 0.97 p = 0.45); V50 = -49 mV in control and -51 mV in PMA, slope = -7.38 in control and -7.4 in PMA. (D) Inactivation of I Ba during a 1s step depolarization was not altered by PMA. Control cells or cells treated with PMA for 5–10 minutes were stimulated with a 1s step to +10mV and the evoked currents normalized to the peak amplitude to enable better comparison of the inactivation time-course. Traces show the means but error bars are omitted for clarity. (E) Recovery from “fast” inactivation was not significantly different in control cells or PMA treated cells (200nM for 5–10 minutes). Inactivation of I Ba was produced by 1s prepulse and recovery determined by a brief test pulse after the indicated interval. This was repeated once every 60s (see inset above graph for voltage-protocol). Current amplitude during the recovery test pulse was normalized to peak I Ba evoked by the prepulse. The solid lines show double exponential fits to the data. (F) PMA prolonged recovery from “slow inactivation”. Inactivation of I Ba was produced by 10s prepulse and recovery was tracked using a series of brief test pulses applied at the indicated time points following the 10s prepulse (see inset). This was repeated twice in the same cell, once before application of PMA ((Ctl) and once in the presence of PMA (after 5-min exposure). Solid lines show double exponential fits to the mean data (control A1 = 0.23, A2 = 0.73, t1 = 1.21 s, t2 = 18.96 s; PMA A1 = 0.12, A2 = 0.76, t1 = 1.06 s, t2 = 49.2 s, fit comparison F = 27.6 p < 0.0001). The inset bar graph shows the mean time-constant for the slow phase of recovery calculated from fits to the individual cells (*** p = 0.001, paired t-test).

