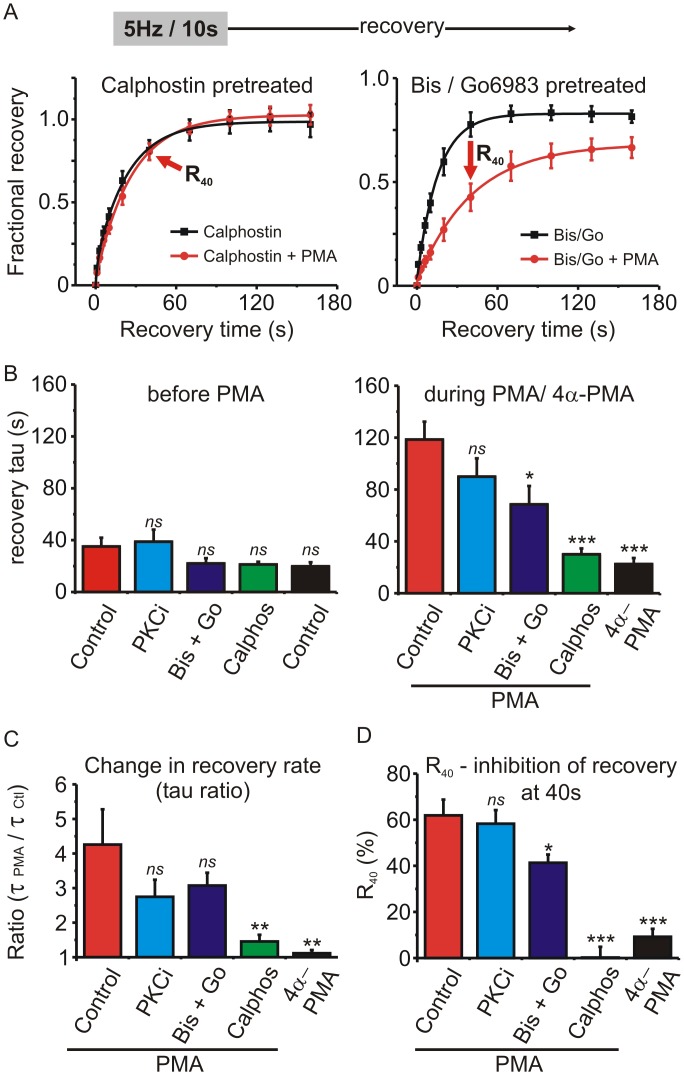
Fig 5. Testing the involvement of PKC in the prolonged recovery from inactivation produced by PMA.
(A) Cells were pretreated with calphostin C (200 nM) or a mixture of bisindolylmaleimide-1 (Bis; 500 nM) + Go6983 (100 nM). Inactivation was produced by a stimulus train (5Hz for 10s as in Fig 4) and the fractional recovery from inactivation determined first in the absence and then in the presence of PMA. Solid lines show an exponential fit to the mean data (left panel: calphostin A = 0.95, t = 17.2 s; calphostin + PMA A = 1.0, t = 23.7 s, comparison of fits F = 3.62 p = 0.06: right panel: Bis/Go A = 0.80, t = 15.6 s; Bis/Go + PMA A = 0.67 t = 40.7 s, comparison of fits F = 25.3 p < 0.0001). The arrows labeled “R40“denote the 40s recovery time point. (B) Plots the mean recovery time constant determined from an exponential fit in each cell before (left panel) and during (right panel) application of PMA, or the inactive control 4α-PMA. “Control” = no pretreatment (n = 6); “PKCi” = cells recorded with intracellular application of a pseudosubstrate peptide inhibitor of PKC (2 μM PKC(19–36) (n = 6); “Bis + Go” = cells pretreated with bisindolylmaleimide-1 (500nM) + Go6983 (100nM) (n = 6); “Calphos” = cells pretreated with calphostin C (200 nM) (n = 7). Also shown is data for cells treated with 4α-PMA (n = 4). Pretreatment with the various drugs did not significantly alter the recovery time constant before application of PMA (left panel). The effect of PMA was significantly reduced by pretreatment with Bis + Go or calphostin C (right panel) (ns, not significantly different, * p < 0.05, *** P < 0.001 compared to the control PMA cells (red bar) determined using one-way ANOVA and Dunnett’s post-test). (C) To quantify the change in recovery rate produced by PMA, a ratio of the recovery time constants was calculated in each cell (tau in the presence of PMA / tau before application of PMA). Statistical significance compared to the control PMA cells (red bar) was determined using one-way ANOVA and Dunnett’s post-test (ns, not significantly different, ** P < 0.01). (D) Another index to compare the various drug treatments is the percent inhibition of recovery at the 40 s time point (R40—see panel A and results section for more detail). Statistical significance compared to the control PMA cells (red bar) was determined using one-way ANOVA and Dunnett’s post-test (ns, not significantly different, * p < 0.05, *** P < 0.001).

