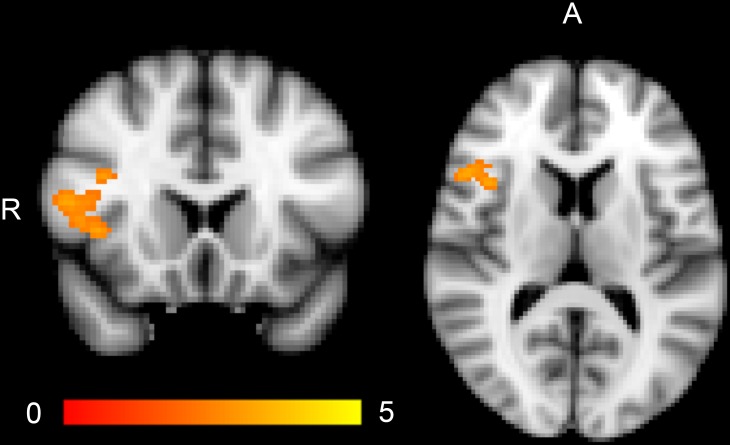
Fig 2. Bipolar disorder polygenic risk score is positively correlated with BOLD activation in the right inferior frontal gyrus in the entire sample (N = 206) including bipolar disorder cases and healthy controls for the Negative Faces > Shapes contrast.
Color bar indicates z values. Coordinates are given in MNI space. Y = 18 (coronal view), Z = 12 (transversal view). Abbreviations: R, right; A, anterior.

