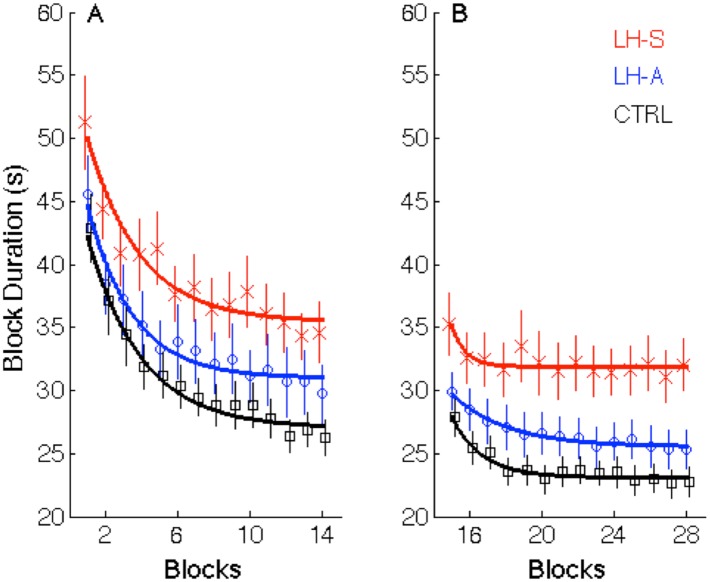
Fig 2. Block Duration in Session 1 (A) and Session 2 (B).
Data points represent group means for each block and error bars depict standard errors. Black squares = healthy controls; blue circles = left hand asymptomatic (LH-A) patients with PD; red crosses = left hand symptomatic patients (LH-S) with PD. Thick solid lines represent group-averaged trajectories based on a single exponential fit.

