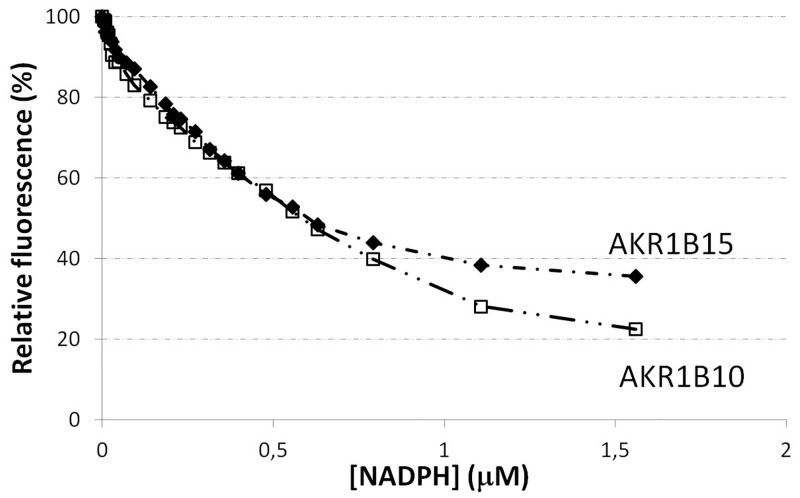
Fig 2. Quenching of AKR1B15 and AKR1B10 fluorescence upon binding of NADPH.
Change of the protein fluorescence intensity (in percentage) upon addition of cofactor is shown. All proteins were used at a concentration of 0.5 μM in 20 mM sodium phosphate, pH 7.0, at 25°C. Graph symbols: AKR1B15 (diamonds), AKR1B10 (open squares).

