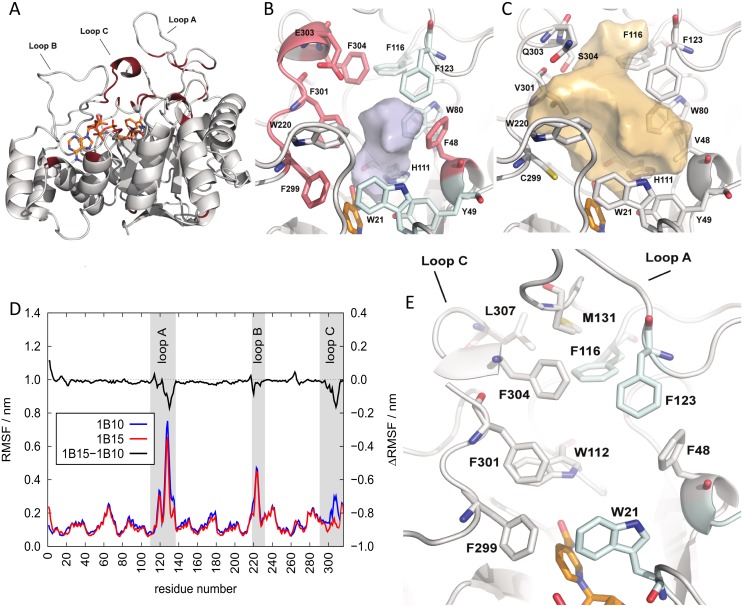
Fig 4. Model of AKR1B15 structure.
(A) Side view of the (α/β)8 barrel. In red, the divergent residues between AKR1B15 and AKR1B10. (B) and (C) Active-site pockets of AKR1B15 and AKR1B10, respectively. The AKR1B15-specific residues are displayed in magenta. NADP+ cofactor is colored in orange. The surface contour of pockets is shown in grey and orange for AKR1B15 and AKR1B10, respectively. (D) The local conformational changes in holo forms of AKR1B15 (red line) and AKR1B10 (blue line) derived from computer simulations, as indicated by root mean square fluctuations (RMSF) of backbone atoms. The residues of loops A, B and C are highlighted by grey background. The difference in RMSF between the two enzymes is displayed as a black line in the top. (E) AKR1B15 loops A and C indicating potential contacts between different residues are shown as sticks, which may explain the low flexibility of the protein in this region. Figures have been drawn using PyMOL.

