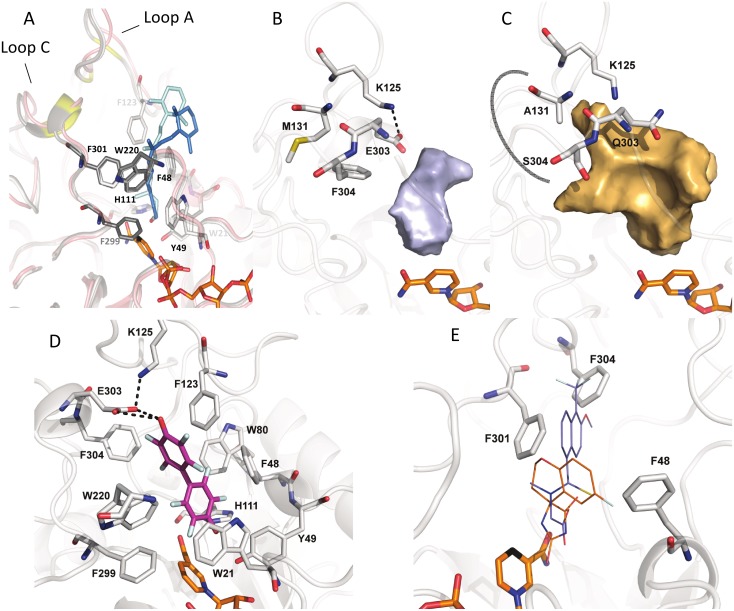
Fig 6. Molecular docking of substrates or inhibitors to the active-site pocket of AKR1B15.
(A) Residues implicated in binding all-trans- and 9-cis-retinaldehyde are displayed in light and dark grey sticks; while the substrates are shown in light and dark blue, respectively. The residues found in the most external part of all-trans-retinaldehyde binding channel in AKR1B10 are highlighted in yellow. The energy minimized apo-conformation is displayed in magenta cartoon. (B) and (C) Side view of the surface contour of the active-site pocket, depicted in grey and orange for AKR1B15 and AKR1B10, respectively, to show the inhibitor “specificity pocket”. A thick grey curved line indicates the “specificity pocket” in AKR1B10. As it is shown, this pocket may not be opened in AKR1B15, likely due to the presence of bulky Phe residues. (D) The inhibitor JF0064 (PDB ID 4ICC) bound to AKR1B15 is displayed as sticks with C atoms in magenta, while residues interacting with the inhibitor are shown as sticks with C atoms in grey. (E) Steric hindrance preventing tolrestat (in blue) and sorbinil (in orange) from binding to the active site of AKR1B15. For this analysis, the AKR1B15 structure model was superimposed with the AKR1B10 crystallographic structures with tolrestat (PDB ID 1ZUA) and sorbinil (PDB ID 4GA8). NADP+ is colored in orange. Figures have been drawn using PyMOL.

