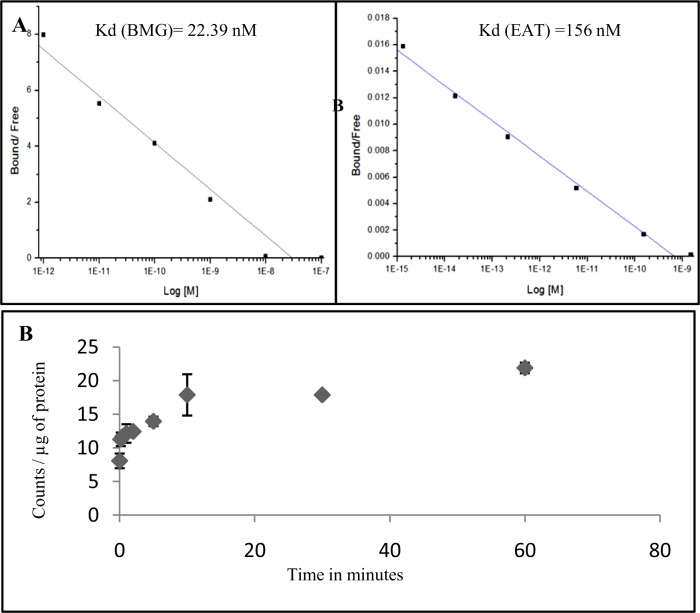
Fig 3. Cell binding assay and uptake kinetics of DT(GSHMe)2 A&B) Representative scatchard plot resulting from competitive binding assay of 99mTc-DT(GSHMe)2 on BMG-1 and EAT cells.
Resulting Kd of 22.9 nM and 156 nM was observed in BMG-1 and EAT cells respectively C) Graphical representation of time course and kinetics of 99mTc- DT(GSHMe)2 on EAT cells.

