
Figure 4.
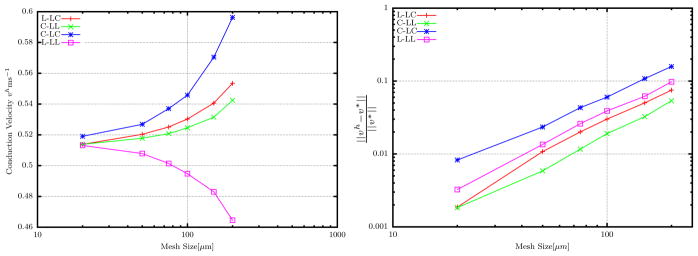
Convergence of different formulations. The plot on the right is plotted using log–log scale. All schemes show similar to convergence rates, however L-LL converges from the bottom while the other schemes from top and F-LF does not approach the converged value v*.