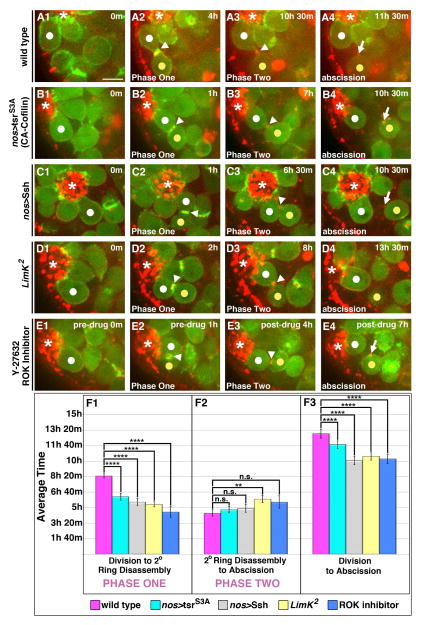
Figure 4. Phase One is regulated by a ROK-LimK-Cofilin pathway.
(A1–E4)Time lapse imaging of GSC division cycle; ABD-moeGFP and Myo-mCherry. Each panel is a 3–5 Z plane projection. m=min. h=hour. White dot=GSC. Yellow dot=Gb. Arrowhead=IC bridge. Arrow=midbody remnant. *=Hub. Scale bar=5 microns
(A1–A4) GSC in wild type followed from division through abscission.
(B1–C4) GSCs expressing a constitutively active form of Cofilin (B1–B4) or the Cofilin phosphatase Ssh (C1–C4) followed from division through precocious abscission.
(D1–D4) GSC depleted of LimK followed from division through precocious abscission.
(E1–E4) GSC in testis treated with the Y-27632 ROK inhibitor followed form division through precocious abscission.
(F1–F3) Quantification of timing of indicated phases. (F1) Increased cofilin activity significantly shortened Phase One (p<10−4 for all conditions). (F2) With the exception of LimK2 mutants (p=0.001), the length of Phase Two remained unchanged in GSC-Gb pairs with increased Cofilin activity compared with wild type controls (nos>tsrS3A p=0.95; nos>Ssh p=0.31; ROK inhibitor p=0.05). (F3) The average time from division to abscission was significantly reduced in all GSC-Gb pairs with increased Cofilin activity compared with controls (p<10−4 for all conditions). Data are represented as mean +/− SEM.

