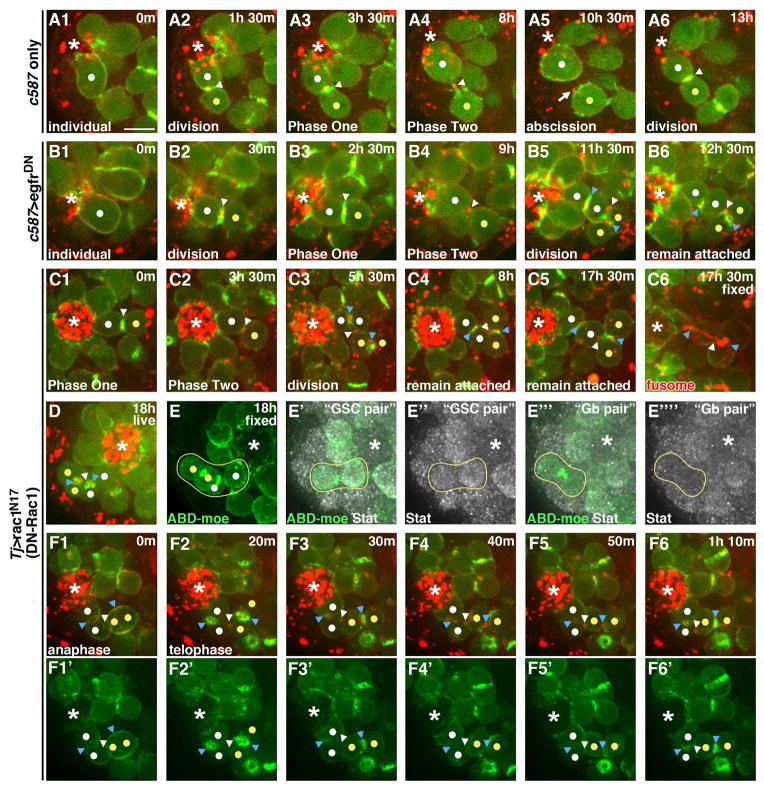
Figure 7. Somatic cell encystment controls GSC-Gb abscission.
Time lapse imaging of ABD-moeGFP and Myo-mCherry in the indicated genotypes. Each panel is a 2–5 Z plane projection. m=min. h=hour. White dot=GSC and “new” GSC daughter generated after second division. Yellow dot=Gb and “new” Gb daughter generated after second division. White arrowhead=“original” IC bridge. Blue arrowheads=“new” IC bridges. Arrow=midbody remnant. *=Hub. Scale bar=5 microns.
(A1–A6) GSCs expressing the c587 GAL4 driver only progressing through mitosis, abscission and a second mitosis.
(B1–B6) GSCs expressing a dominant-negative form of egfR using the c587 driver. After a first cell division, the GSC-Gb pair fails to abscise so that following a second mitosis, an interconnected group of four cells is formed (B5) and retained (B6) at the hub.
(C1–C4) GSCs expressing a dominant-negative form of Rac1 using the tj driver. The GSC-Gb pair fails to abscise so that following a second mitosis, an interconnected group of four cells is formed (C3) and maintained (C4) at the hub.
(C5) Same GSC-Gb pair imaged (C1–C4) fixed and stained for GFP and the fusome (red).
(D) Last time point from live imaging of GSCs expressing dominant-negative Rac1 using the tj driver.
(E–E‴′) Imaged GSC (from D) fixed and stained. (E) Z projection showing all four interconnected cells attached to the hub. (E′–E″) Z projection of planes containing only the “GSC pair” (cell attached to hub and immediate daughter) showing Stat accumulation. (E‴–E‴′) Z projection of planes containing only the “Gb pair” (two cells most distal from hub in four-cell grouping) showing lack of Stat accumulation.
(F1–F6′) GSCs expressing a dominant-negative form of Rac1 using the tj driver with images collected every 10 min showing loss of contractile ring F-actin and formation of a secondary F-actin ring following division of attached GSC-Gb pair.

