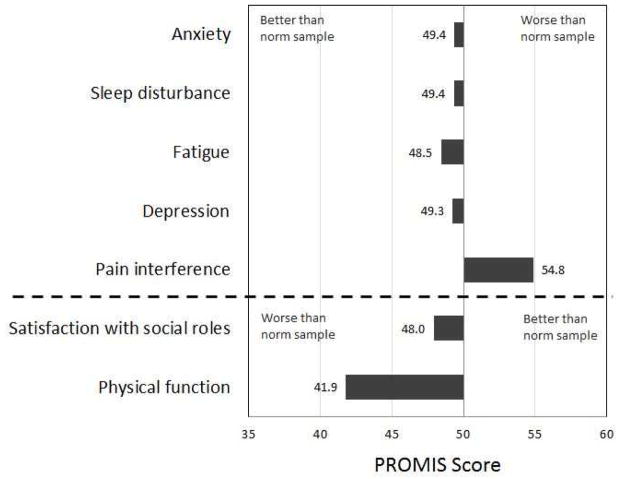
Fig. 1.
PROMIS Profile-29 scores for the overall sample of people with LLL (N=1091). The bars represent the mean score in each domain. Scores above 50 indicate that the sample of people with LLL had more of the measured construct (e.g., anxiety, sleep disturbance) and scores below 50 indicate that the sample of people with LLL had less of the measured construct. 50 represents the mean of the large samples representative of the US general population, except for sleep disturbance where 50 represents a mean of a large sample that includes a slightly higher proportion of less healthy people than the general population.

