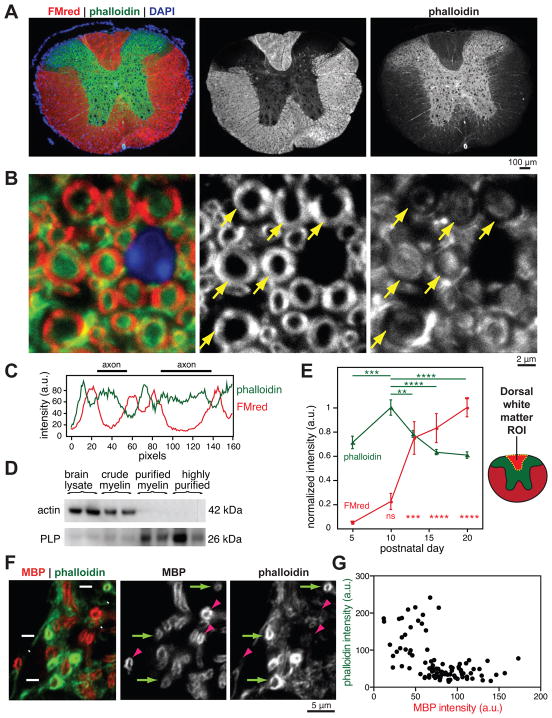
Figure 1. Loss of actin filaments during myelination in vivo.
(A–C) P45 mouse spinal cord transverse sections stained for compact myelin with FluoroMyelin Red (FMred, red), actin filaments with Alexa 488-phalloidin (phalloidin, green), and nuclei (DAPI, blue). (A) Wide field epifluorescence showing low levels of actin filaments in mature white matter. (B) Confocal microscopy revealed lowest levels of actin filaments (phalloidin, green) in compact myelin (FMred, red). Arrows point to compact myelin.
(C) Representative line scan through two myelinated axons from (B); a.u., arbitrary units.
(D) Immunoblotting of brain lysate and fractionated compact myelin from adult mice. n = 3 mice fractionated on two separate days.
(E) Wide field quantification of phalloidin and FMred staining intensities in mouse dorsal white matter regions of interest (ROI) during postnatal development. Error bars: SEM from n = 5–6 animals per time point; multiplicity adjusted P values shown for P10 (phalloidin) or P5 (FMred) compared to other days, calculated using Tukey’s multiple comparisons test, ***p < 0.001, ****p < 0.0001.
(F and G) Confocal microscopy of developing P5 mouse spinal cord transverse sections, stained for MBP (red) and phalloidin (green). Arrows, early sheaths with low MBP intensity and high phalloidin intensity. Arrowheads, more mature sheaths with high MBP intensity and low phalloidin. (G) Quantification of individual P5 myelin sheaths showed that actin filament levels (phalloidin) decreased with increasing MBP intensity.
See also Figure S1.

