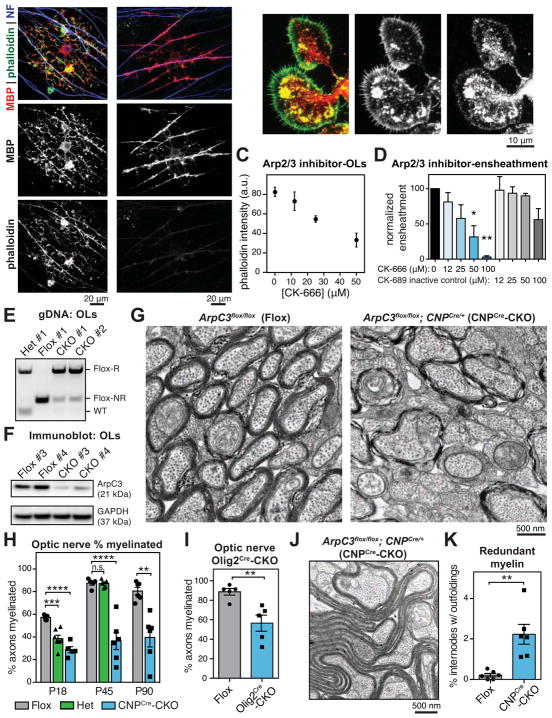
Figure 3. Actin assembly by Arp2/3 is required for myelin initiation.
(A) Cocultures of DRG neurons and OPCs grown for 7 (left) or 9 (right) days, then fixed and stained for MBP, phalloidin, and axons (neurofilament, NF).
(B) OPCs were differentiated for 1d and immunostained for the Arp2/3 subunit ArpC1 (red), and counterstained with phalloidin (green).
(C and D) OLs required Arp2/3 for normal levels of actin filaments and to ensheath axons. (C) A dilution series of Arp2/3 inhibitor CK-666 was applied to OLs for 24 hr, then OLs were fixed and stained for actin filaments with phalloidin (see also Figure S3). (D) Axon ensheathment assay of OPCs on RGC neurons, treated with a dilution series of CK-666 or the inactive control compound CK-689. Graph shows quantification of axonal ensheathment per Olig2+ OPC/OL, normalized to DMSO-treated controls. n = 2 experiments. *p < 0.05, **p < 0.01, Dunnett’s multiple comparison test.
(E and F) Recombination (E) and reduction of ArpC3 protein (F) in OLs purified from P18–20 ArpC3Flox/Flox (Flox), ArpC3Flox/+; CNPCre/+ (heterozygote) and ArpC3Flox/Flox; CNPCre/+ (CNPCre-CKO) mice by immunopanning. Flox-R, recombined; Flox-NR, non-recombined; bands were confirmed by sequencing. n = 4 CNPCre-CKO, 3 Flox, 1 heterozygote. (F) Immunoblot showing reduction of ArpC3 protein in CNPCre-CKO OLs. n = 2 animals per genotype.
(G and H) Transmission electron microscopy of optic nerves from Flox (left), CNPCre-CKO (right), and heterozygote (not shown) mouse littermates. Quantification in (H) shows percent axons myelinated at P18, P45, and P90. Each data point is average from a single animal. n = 5–7 animals per age, per genotype. **p < 0.01, ***p < 0.001, ***p < 0.0001, Dunnett’s multiple comparison test (P18 and P45) or Student’s t-test (P90).
(I) Percent axons myelinated in optic nerves from P72 Flox and ArpC3Flox/Flox; Olig2Cre/+ (Olig2Cre-CKO) mouse littermates. n = 5 animals per genotype; **p < 0.01, Student’s t-test.
(J) EM micrograph shows an example of a myelin outfolding in a P90 CNPCre-CKO mouse.
(K) Quantification of outfoldings in Flox versus CNPCre-CKO littermates at P90. n = 6 animals per genotype; **p < 0.01, Student’s t-test.
Error bars: SEM.
See also Figures S2, S3, S4, S5, and Movies S2 and S3.

