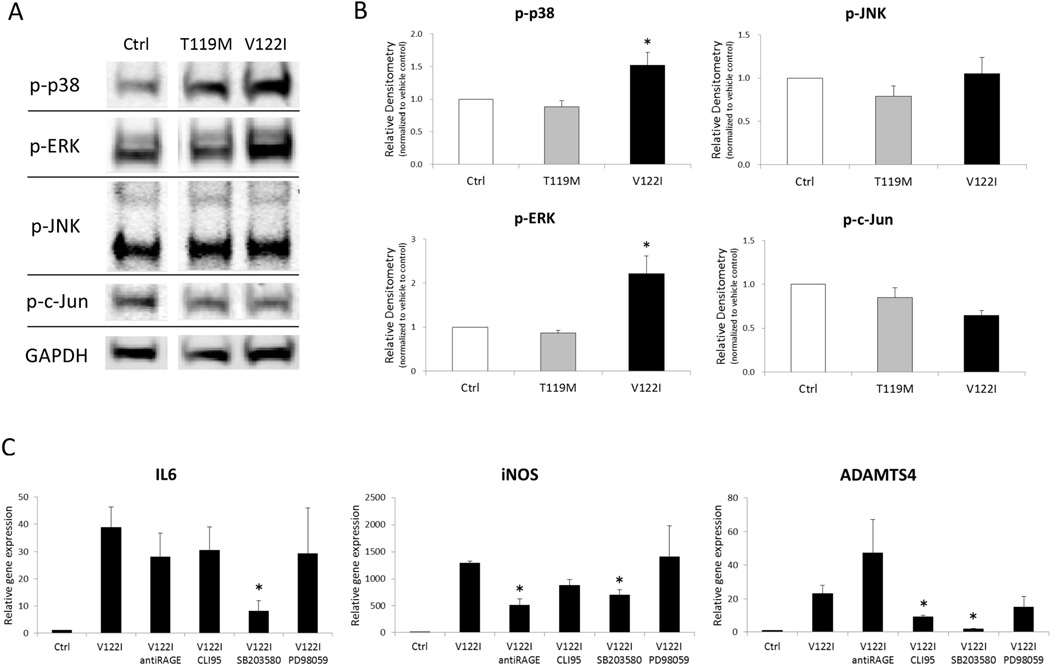
Figure 5. Kinases and receptors mediating TTR effects on human chondrocytes.
(A) Representative images of western blotting for phosphorylated MAPK in chondrocytes treated with TTRs. (B) Graph shows the quantification of phosphorylated MAPK in 3 human chondrocyte preparations treated with 4 µM of TTRs for 24 h. Values are the mean and SD as the ratio of TTRs treated cells to vehicle-only treated cells. * = P < 0.05 versus Control. (C) Chondrocytes co-treated with 4 µM of V122I and antibody to RAGE, CLI95, SB203580 and PD98059 for 24 h. Graph shows the changes in gene expression of 3 donors. Values are the mean and SD. *P < 0.05 versus V122I TTR.

