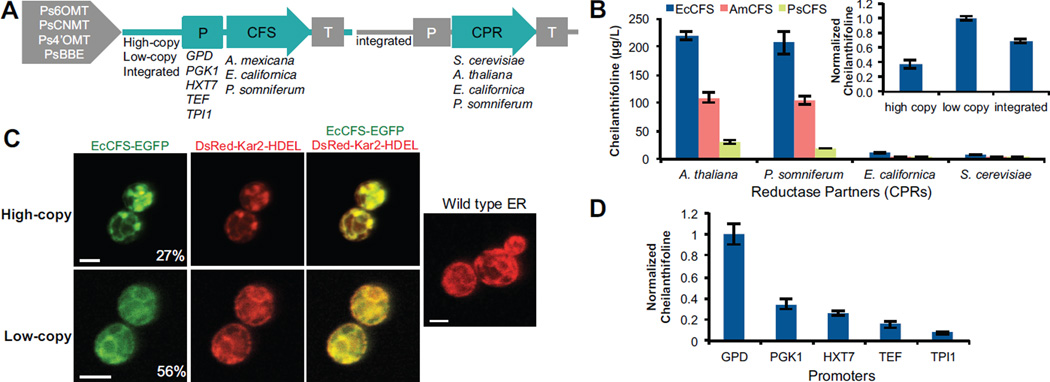
Figure 2.
Optimization of (S)-cheilanthifoline production through genetic strategies. (A) Schematic representing genetic strategies used to optimize cheilanthifoline production, including expression method (plasmids or integrated), promoter, species variants, and CPR variants. All strains contain Ps6OMT, PsCNMT, Ps4’OMT, and PsBBE chromosomally integrated. (B) Cheilanthifoline production in yeast strains as a function of CFS and CPR variants. Variants of CFS from E. californica (EcCFS), A. mexicana (AmCFS), and P. somniferum (PsCFS) were expressed from low-copy plasmids in yeast strains with an integrated cytochrome P450 reductase enzyme (CPR) from either the native yeast (CSY953) or various plant sources (A. thaliana, CSY844; E. californica, CSY850; P. somniferum, CSY985). Inset, cheilanthifoline production with EcCFS and ATR1 as a function of expression method, normalized to production from the low-copy plasmid. (C) Confocal microscopy analysis of EcCFS C-terminally tagged with GFP on high-copy (top) or low-copy (bottom) plasmids coexpressed with ER marker Kar2-DsRed-HDEL in CSY844. Wild-type ER (no heterologous P450 expressed) is shown for comparison (right). Percentages indicate portion of the yeast population that are GFP positive under the indicated expression condition. Scale bars are 4 µm. Images are representative of at least 3 independent experiments. (D) Cheilanthifoline production in yeast strains engineered to express EcCFS from a low-copy plasmid under the control of different promoters in CSY844. Data are normalized to production from PGPD. (B, D) Metabolite production is determined by LC-MS analysis of culture media after indicated strains were grown for 96 h. Data is reported as the mean ± s.d. of at least 3 independent experiments.

