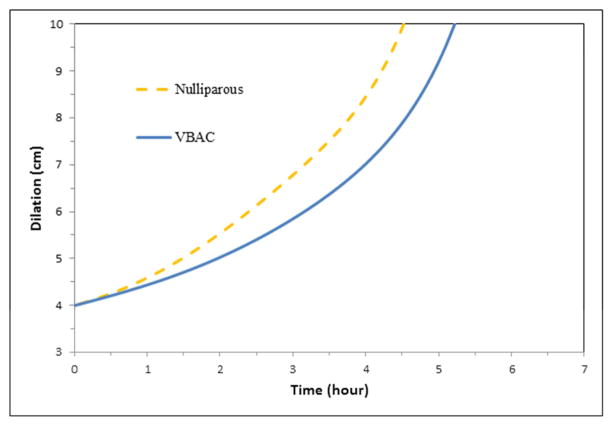
Figure 2. Mean labor curves for induced labor.
Mean labor curves in singleton term pregnancies with induction of labor, vaginal delivery, and normal neonatal outcomes for women (parity=1) with one prior cesarean and successful vaginal birth after cesarean (VBAC) and nulliparous women. Term was defined as delivery between 37 and 41 weeks of gestation. Antepartum stillbirths, women with uterine rupture, and neonates with fetal anomalies, 5 minute Apgar score < 7, sustained a birth injury or were admitted to the neonatal intensive care unit were excluded.

