
FIGURE 2.
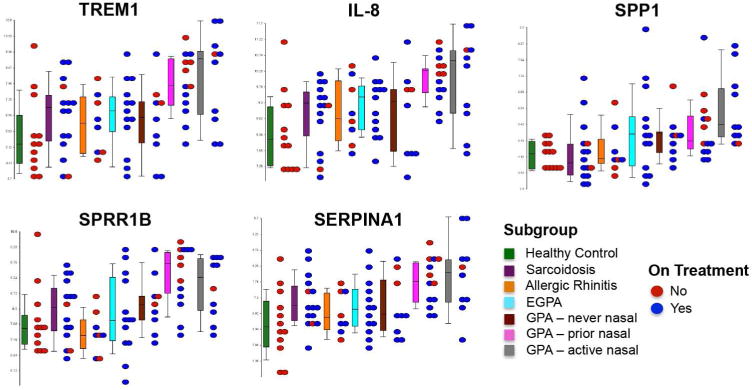
Dot plots illustrating microarray-based gene expression values of 5 selected candidate genes across all of the different subgroups in this study. The boxplots show the range of gene expression for each gene. The dots show individual patient data within each subgroup and are color coded to reflect treatment status [red = not on treatment for disease; blue = patient receiving either oral glucocorticoids, nasal glucocorticoids, or other immunosuppressant agents]. Significantly increased expression in patients with GPA with active or prior nasal disease was observed for all candidate genes (p<0.001). There was a trend of increased SPP1 and SPRR1B expression in all subgroups of patients with GPA relative to the composite comparator groups with highest expression of SPP1 observed in the GPA subgroup with active nasal disease and the highest expression of SPRR1B observed in the GPA subgroup with prior nasal disease.