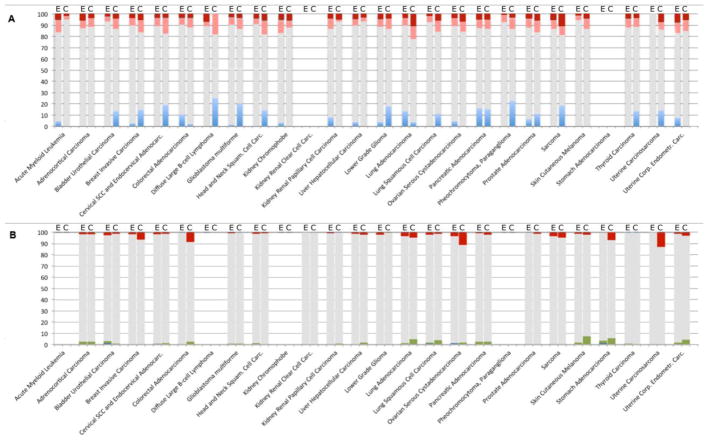
Figure 4. Genomic alterations and expression changes in CASS4 and EFS in cancer.
Data available from the TCGA was extracted using the cBioPortal site (http://www.cbioportal.org). For some tumor sites, data was unavailable for both genomic and mRNA profiles, reflected by empty columns. A. mRNA expression profiles for EFS (E) and CASS4 (C). Dark red: percent of tumor samples with mRNA upregulation with Z-score >2; pink: upregulation with Z-score >1; light blue: percent of tumor samples with mRNA downregulation Z-score <−1; gray: no significant change (−1 < z <1). B. Copy number variations and somatic mutations for EFS (E) and CASS4 (C). Red: percent of tumor samples with gene amplifications; blue: homozygous deletions; green: mutations. Gray represents no change. The fraction of samples with both CNV and mutations in the genes of interest was not significant and is not shown.

