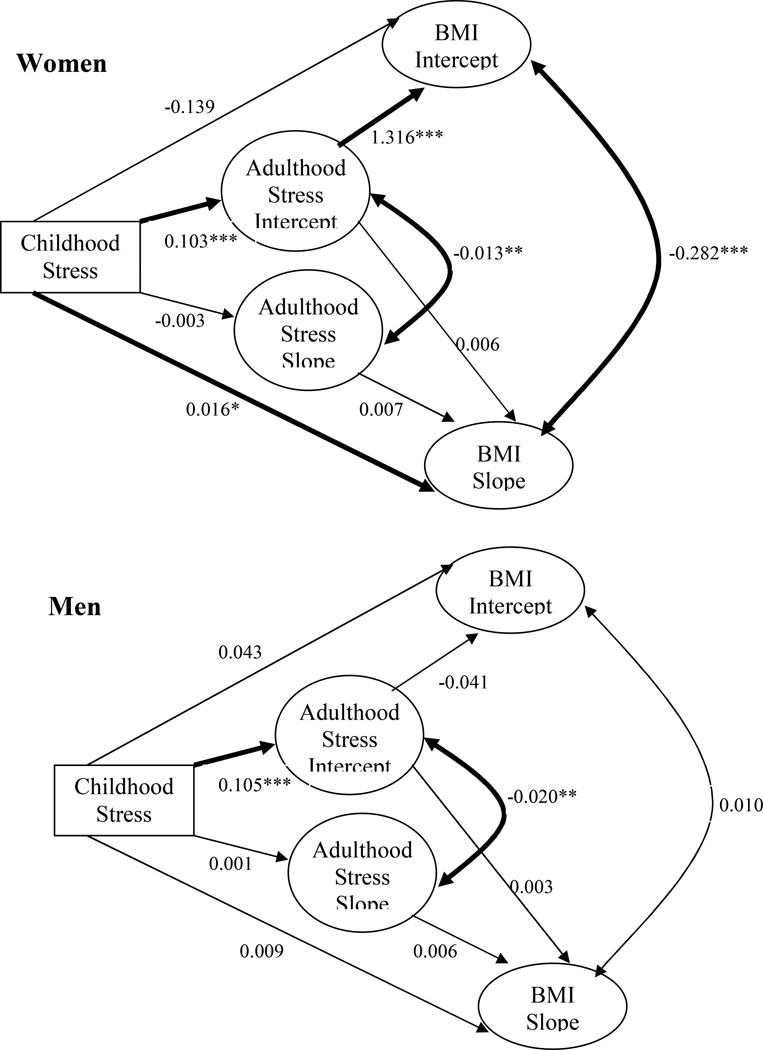
FIGURE 1. Structural Path Diagram of Childhood Stress, Adulthood Stress and BMI Trajectories for Women (N=2259) and Men (N=1358) from the Multiple Group Growth Curve Model.
* p < .05, ** p < .01, *** p < .001. CFI = .987; TLI = .980; RMSEA = .022.
Model controlled for age (T1), age-squared (T1), black (T1), education (T1), family income (T1), previously divorced (T1), previously widowed (T1), marital transitions from T1 to T4, a time-varying covariate of birth as well as death hazard.
Bolded lines indicate significant paths. Numbers are unstandardized regression coefficients in the diagram. The output with standardized coefficients is not available in Mplus for random effects estimates due to the multiple variance/covariance matrix (Muthen & Muthen, 2007)

