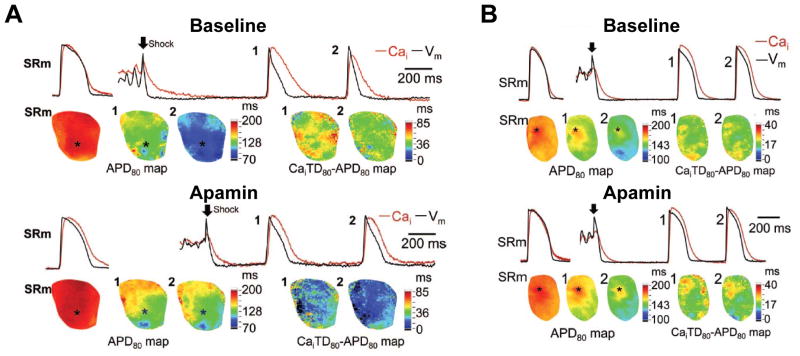
Figure 1.
Effects of apamin (1μmol/L) on APD80 and the differences between Ca2+ transient duration (CaiTD80) and APD80 in failing and normal rabbit hearts. Optical traces (top) of Vm (black line) and Cai (red line) were recorded from site marked by an asterisk in APD80 map (bottom). A. Failing heart. Top subpanel shows epicardial optical traces of Vm and Cai and APD80 map during sinus rhythm (SRm) before pacing-induced VF (left). Top right shows beats 1 and 2 had acute shortening of APD in the immediate post-shock period, resulting in the Cai elevation during late phase 3 and phase 4. Bottom right shows the corresponding APD80 maps, and the maps of the difference between CaiTD80 and APD80 in beats 1 and 2. After apamin (bottom subpanel), the postshock beats 1 and 2 had longer APD80 than those at baseline. The CaiTD80 was similar to that in A, and the differences between CaiTD80 and APD80 in beats 1 and 2 were reduced. B. Normal heart. As compared with the baseline, there were little changes of APD and CaiTD after defibrillation when the tissues were pretreated with apamin. Arrow indicates defibrillation. PI VF, pacing-induced VF; SRm indicates sinus rhythm. From Chua et al (Chua et al., 2011), with permission.

