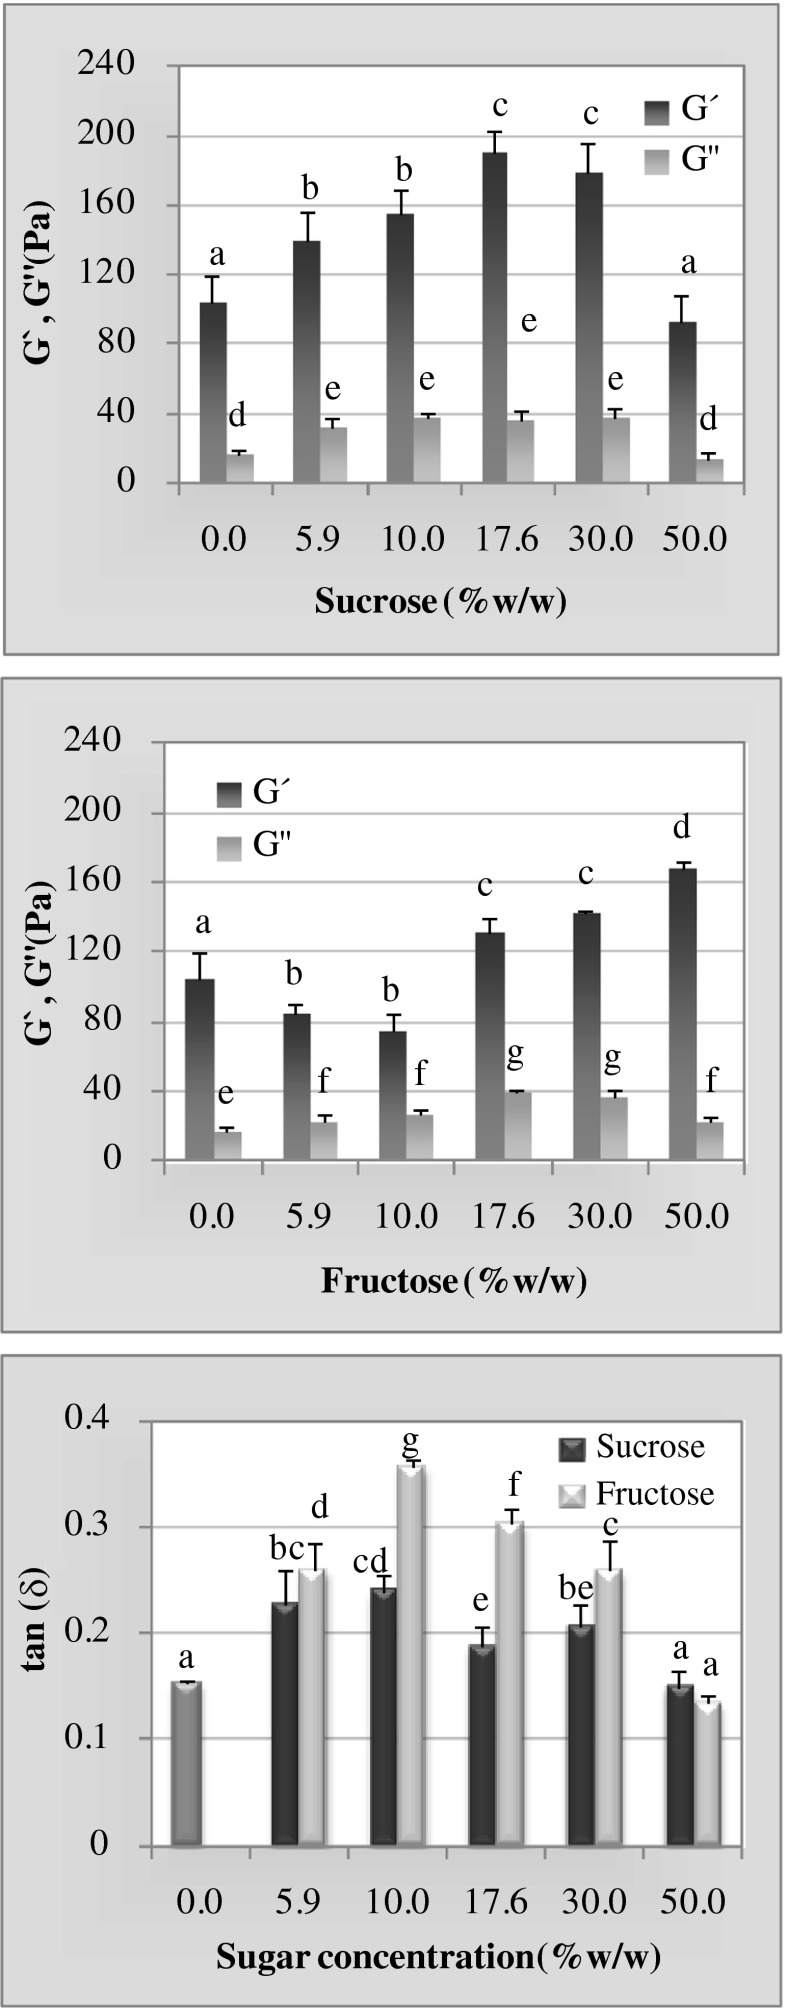
Fig. 3.
The elastic (G’) and viscous (G”) moduli at different sugar concentrations for sucrose (a) or fructose (b) and the loss tangent (tanδ) at the same concentrations of both sugars (c)—all at a frequency of 1 Hz and 20 °C. Within the same graph and in the same parameter different letters above the error bars indicate significant differences (p ≤0.05)

