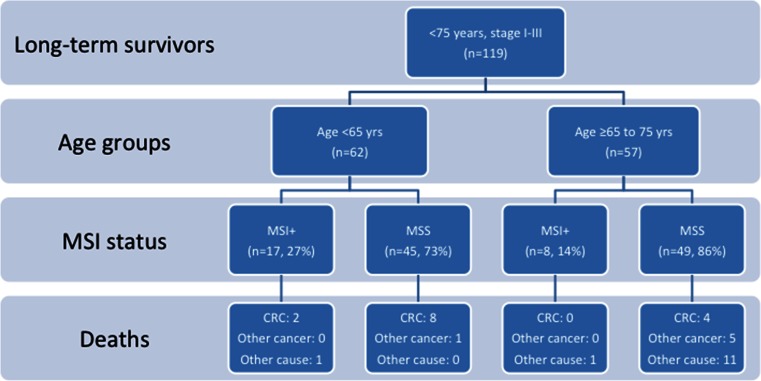
Fig. 3.
Flowchart demonstrating the distribution of long-term survivors who completed the 5-year surveillance programme (suggested as a supplementary figure only if needed due to space restrictions). Distribution (n = 119) according to the age groups, MSI status and cause of death is depicted. MSI+ microsatellite instability, MSS microsatellite stability, yrs years, and CRC colorectal cancer-related death

