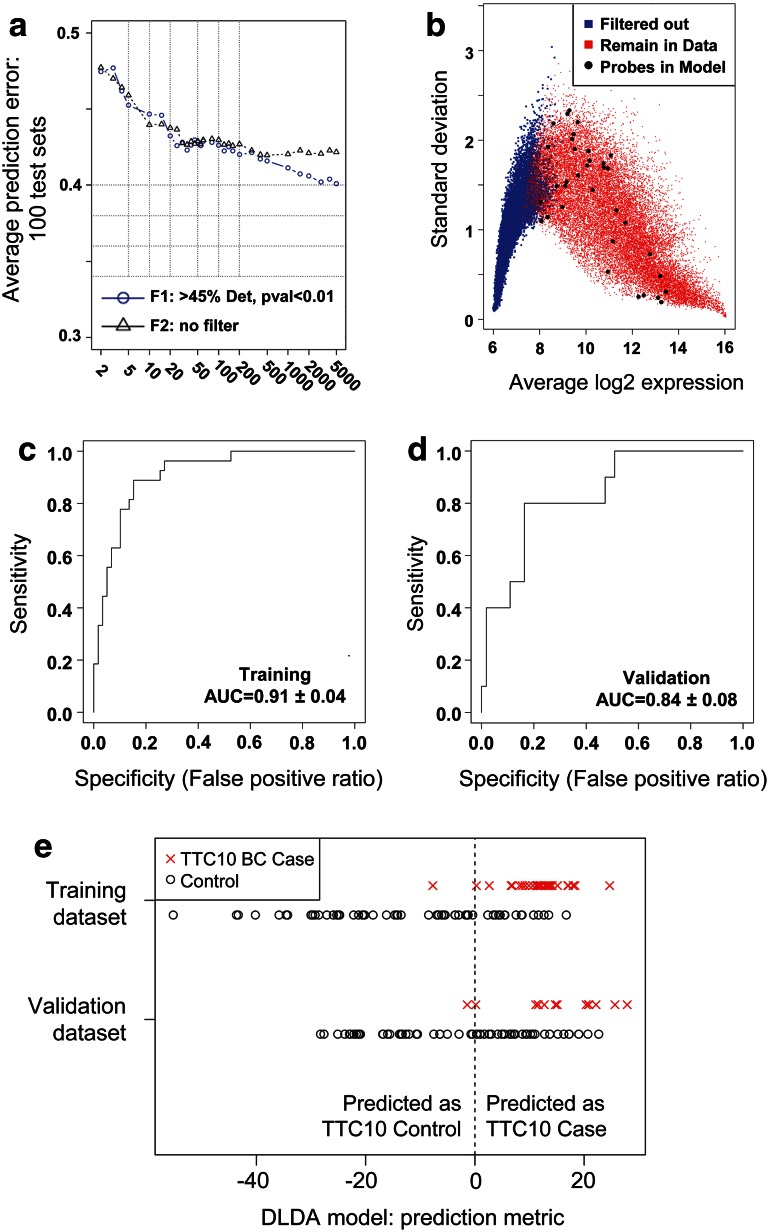
Fig. 2.
Development and validation of SA TTC10 model. a Mean area above the receiver operating characteristic (ROC) curve plotted against the number of top genes included in the classifiers. b Plot of average gene expression values indicating probes which were used for the model building (>45 % positive expression, p < 0.1 for difference between cases and controls) and locations of which probes were included in the model. Probes passing the filtering threshold are shown in red, those filtered out are shown in blue, and those probes selected as final-model features are shown as large black dots. c, d ROC for SA TTC10 model applied to training set (c; N = 86) and validation set (d; N = 65). e SA TTC10 predictions for training and validation dataset cases and controls. The vertical dashed line separates the samples into those predicted to be a TTC10-control (prediction metric ≤0) or TTC10-case (prediction metric >0)

