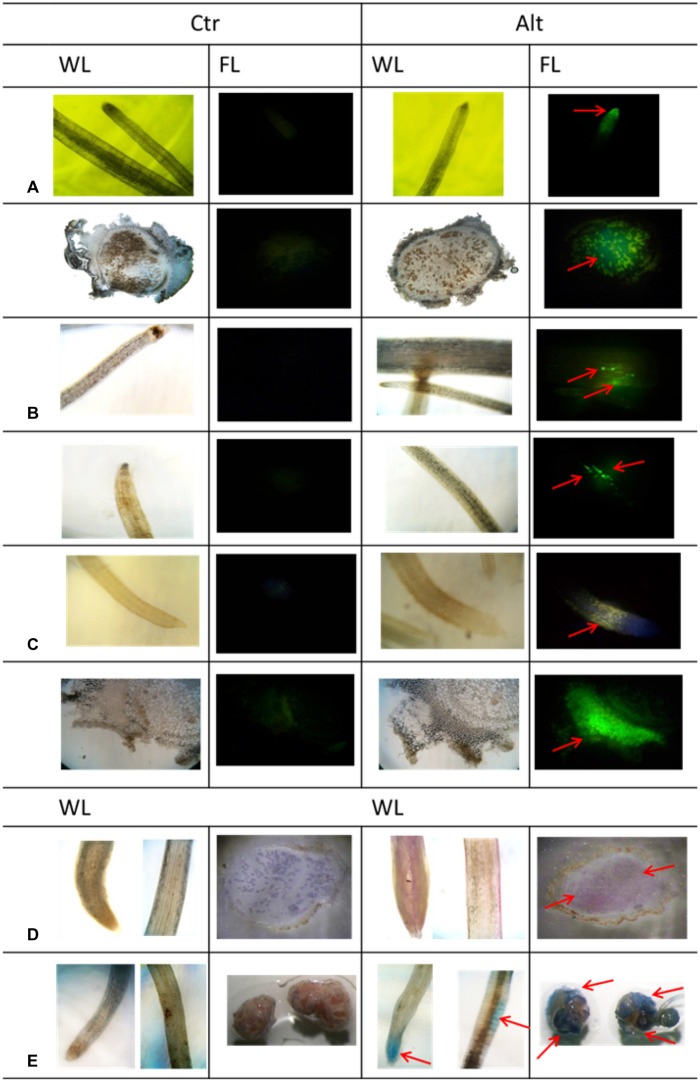
FIGURE 3.
Histological analysis of Al toxicity response in roots and mature nodules of R. tropici-inoculated common bean plants. SNF common bean plants were grown in control (Ctr) or in Al- toxicity (Alt) conditions. (A) Accumulation of Al evidenced by Al-morin fluorescence. Magnification = 10X, for roots and nodules (B) ROS (H2O2) production detected by DCF-DA fluorescence. Magnification = 10X (C) Callose distribution evidenced by fluorescence emitted after aniline blue staining. Magnification = 10X for roots and 20X for nodules. Magnification = 10X for roots and 8X for nodules (D) Lipoperoxidation visualized after Schiff’s reagent staining (E) Cell death visualized after Evans blue staining. Magnification = 10X for roots and 4X for nodules. Red arrows point out the specific symptoms commented in the text. WL, white light, FL, fluorescent light. Each histological analysis was repeated in eight roots or nodule samples from different plants grown in control or Alt treatment, representative images are shown.

