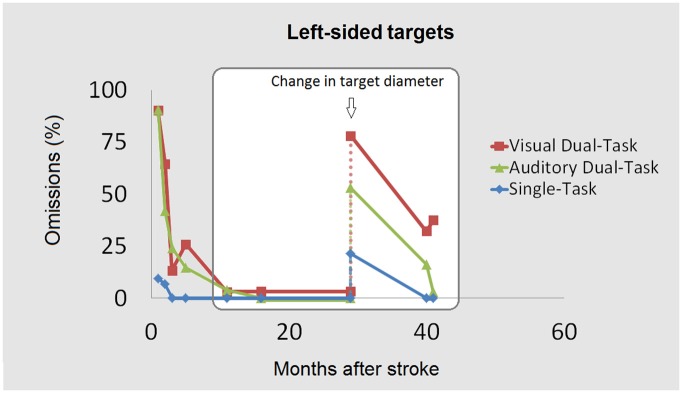
Figure 3.

The contralesional omissions (%) across the three main tasks (ST, ADT, VDT) are shown as a function of the temporal interval between the stroke and the testing. The first three testing sessions (left) within the white square show performance following the presentation of a target with a diameter of 8 mm. The last three testing sessions show omissions obtained with the same tasks (single- or dual-) after target diameter reduction (3 mm). Additional variants (not reported here) show that the effects of response bias/test-retest effects were either limited or absent, confirming that omissions mainly indexed spontaneous recovery. Data points on the left of the square (recovery at earlier stages) are adapted from Bonato et al. (2012).
