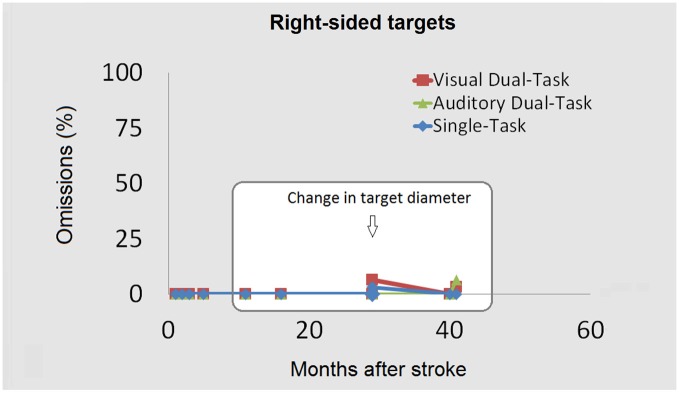
Figure 4.

The ipsilesional omissions (%) across the three main tasks (ST, ADT, VDT) are shown as a function of the temporal interval between the stroke and the testing. The first three testing sessions (left) within the white square show performance obtained by presenting an 8 mm target. The last three testing sessions show omissions obtained with the same tasks (single- or dual-) after target diameter reduction.
