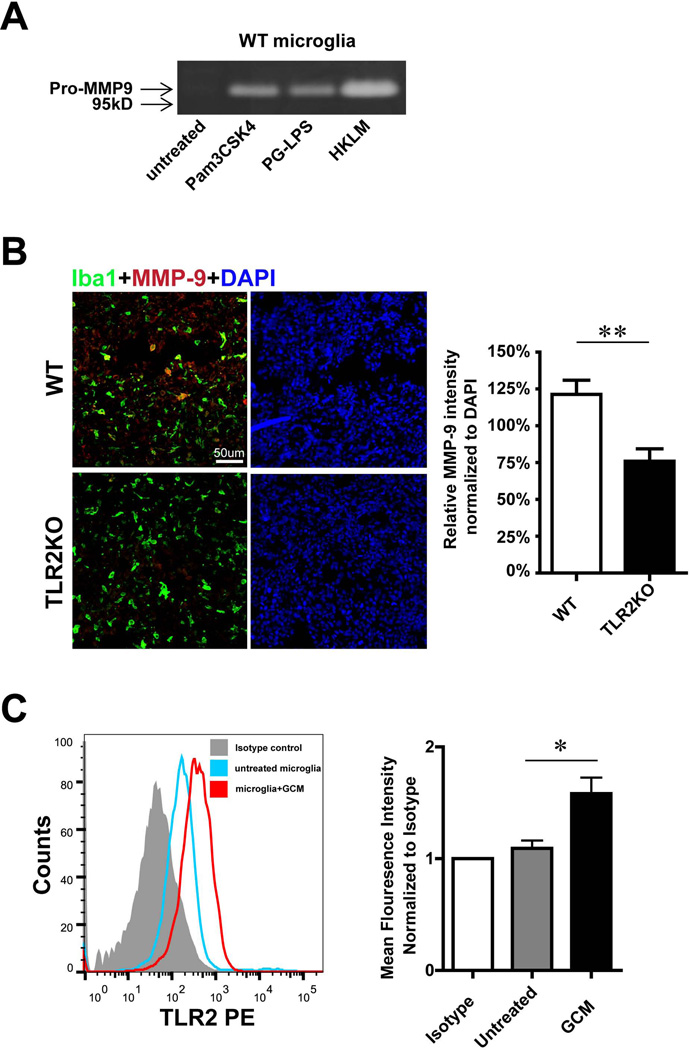
Fig. 4. Microglial MMP-9 as well as TLR2 is regulated by GCM stimulation.
(A) The influence of TLR2 ligands on MMP-9 expression was determined in primary microglia from WT mice. Microglial cells were stimulated with 3 different TLR2 agonists for 24h and levels of MMP-9 in the supernatant were analyzed by gelatin zymography. (B) Slices from glioma inoculated WT and TLR2 KO mice were immunohistologically labeled. Microglia/brain macrophages were identified by the expression of Iba1 (green) and MMP-9 by immunolabelling in red (left), fluorescence intensity was quantified by ImagJ and normalized to DAPI (right). (C) TLR2 expression of microglia upon GCM stimulation for 24 h was analyzed by flow cytometry. Representative histogram of flow cytometry was shown (left panel), mean fluorescence intensity (normalized to isotype control) was used to quantify the expression of TLR2 (right panel). Bars represent the mean±s.e.m. from 6 independent experiments.

