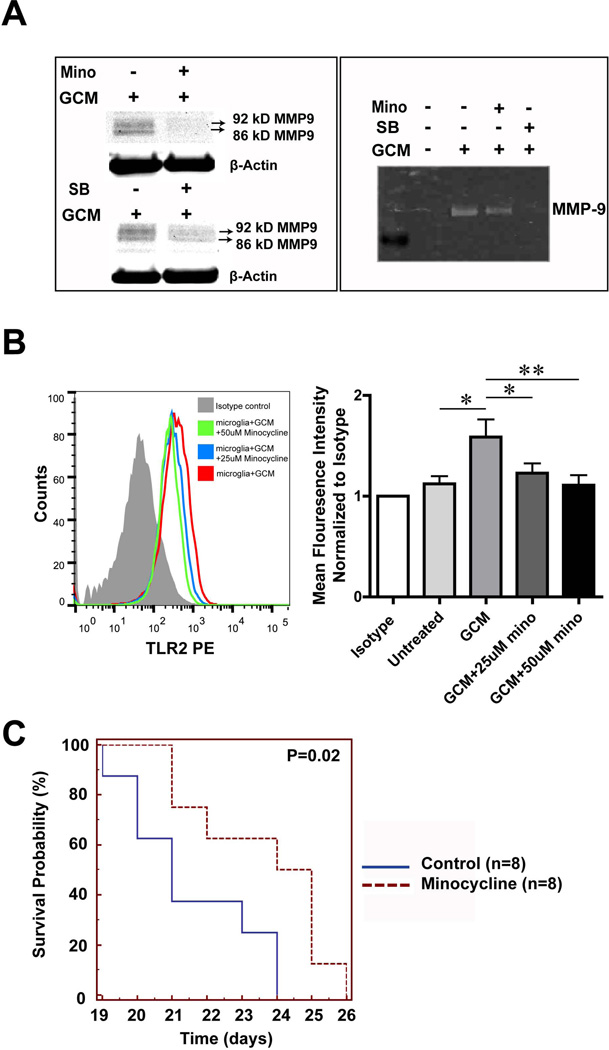
Fig. 5. Minocycline interfers with glioma associated microglial MMP9 and TLR2 induction.
(A) MMP-9 expression is shown by Western blot in the lysate (left) and Gelatin zymography in the supernatant (right) obtained from primary cultured microglia. On the left, cells were stimulated with GCM alone or with GCM combined with either 50 uM minocycline (Mino, upper panel) or 10uM MAPK inhibitor SB202190 (SB, lower panel) for 24h. Similarly on the right panel MMP-9 expression is shown for the supernatant obtained from cells stimulated with GBM alone or combined with minocycline and SB. (B) Microglia was either treated with GCM or GCM together with 25uM or 50uM minocycline for 24 h and TLR2 in microglia was analyzed by flow cytometry (left panel: representative histogram). On the right panel, mean fluorescence intensity was quantified. Bars represent the mean±s.e.m. from 5 independent experiments. (C) The Kaplan-Meier survival curve represents the survival rate of mice bearing tumor with or without minocycline treatment through drinking water (30mg/kg/day).

