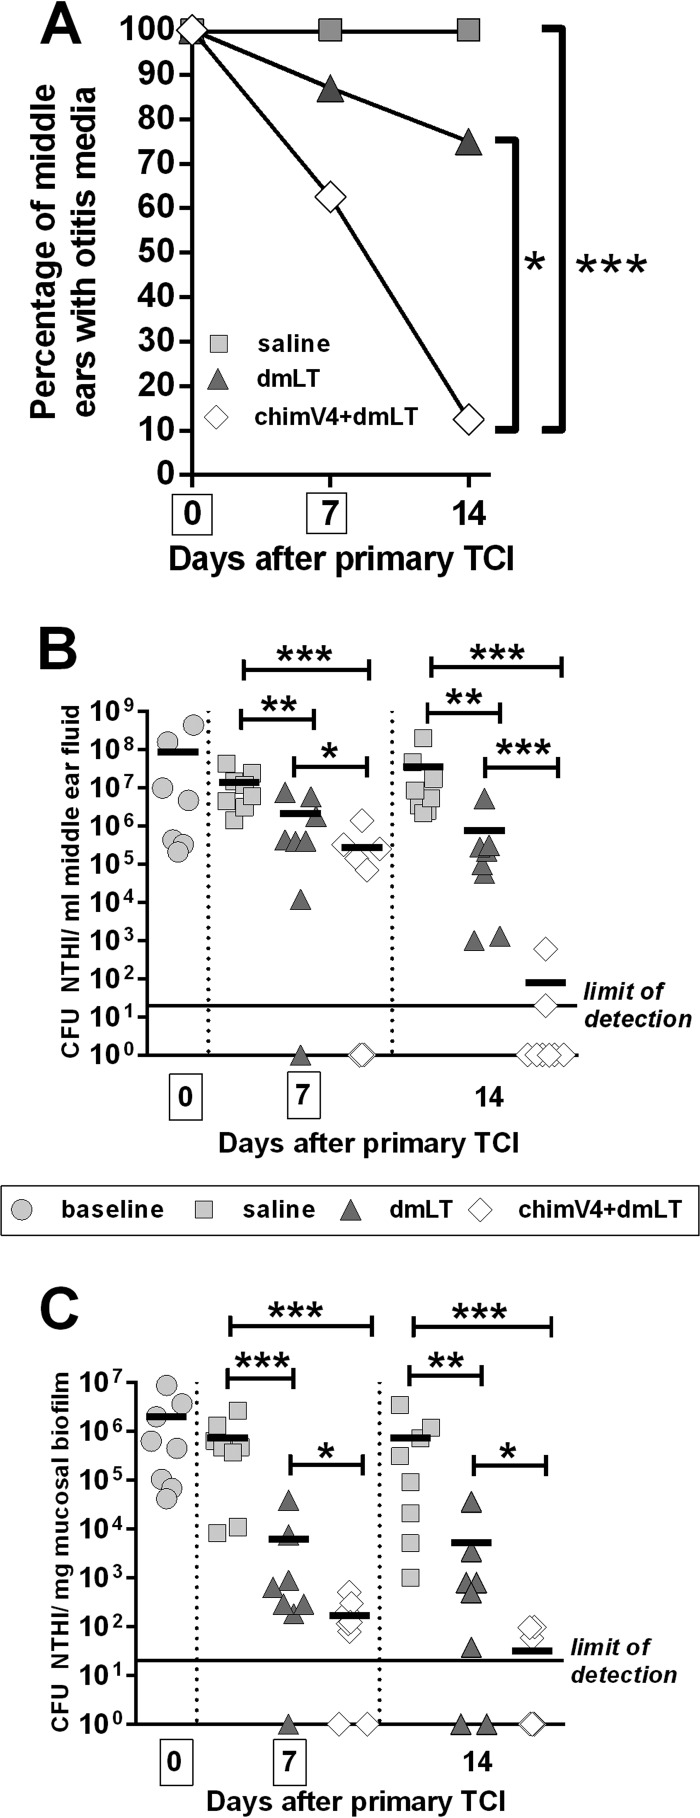
FIG 4.
Kinetics of resolution of experimental OM after TCI with band-aid vaccines placed in the postauricular region. (A) Percentages of middle ears with OM after TCI, as determined by video otoscopy. The mean ± standard error of the mean (SEM) for each cohort is shown. *, P ≤ 0.05; ***, P ≤ 0.001, Mantel-Cox log-rank test. (B) CFU of NTHI per milliliter of middle ear fluid. (C) CFU of NTHI per milligram of mucosal biofilm. TCI with chimV4 plus dmLT eradicated NTHI from middle ear fluid samples and mucosal biofilms beginning 7 days after receipt of the first band-aid vaccine. Boxes around days 0 and 7 on the x axes indicate days of immunization. Values for individual middle ears are plotted, and the mean for each cohort is indicated by short horizontal lines. *, P ≤ 0.05; **, P ≤ 0.01; ***, P ≤ 0.001, one-way ANOVA.

