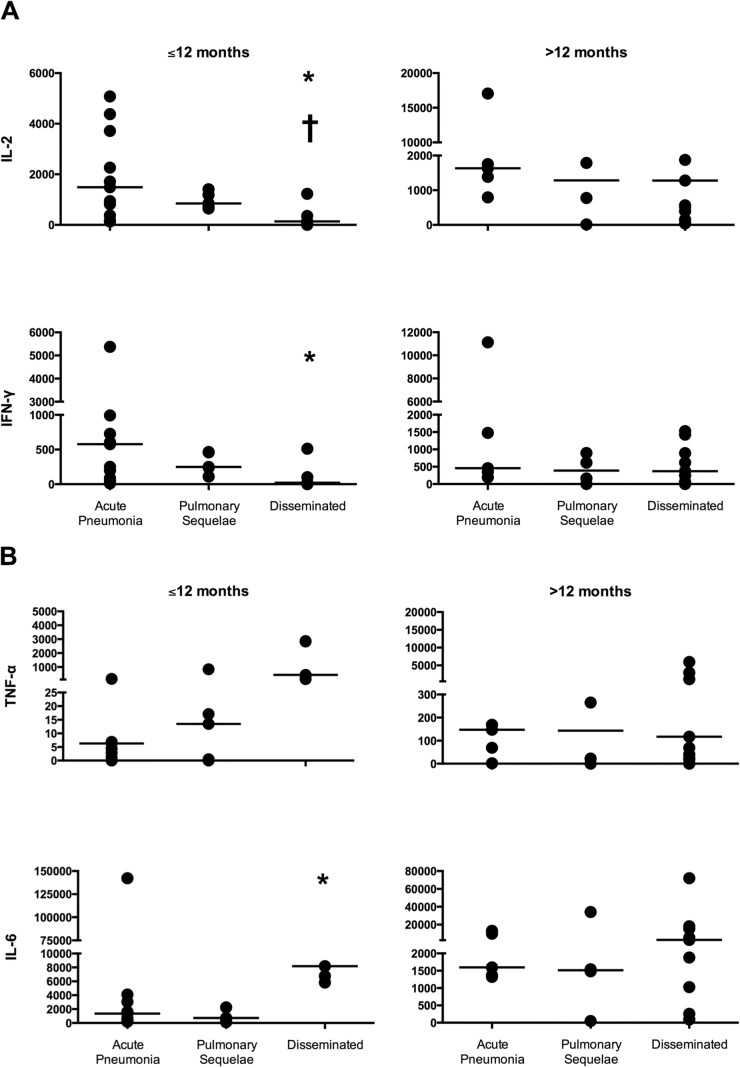
FIG 1.
Concentrations (picograms per milliliter) of IL-2 and IFN-γ (A) and TNF-α and IL-6 (B) for subjects diagnosed ≤12 months and >12 months from the time of the assay. Each value is depicted as a circle with the horizontal line representing the median. Note that the y axes differ for each cytokine. *, P < 0.05 comparing samples from subjects with acute pulmonary disease to samples from subjects with disseminated coccidioidomycosis diagnosed ≤12 months from the time of the assay. †, P < 0.05 comparing samples from those with disseminated coccidioidomycosis with a diagnosis ≤12 months compared to >12 months from the time of the assay.

