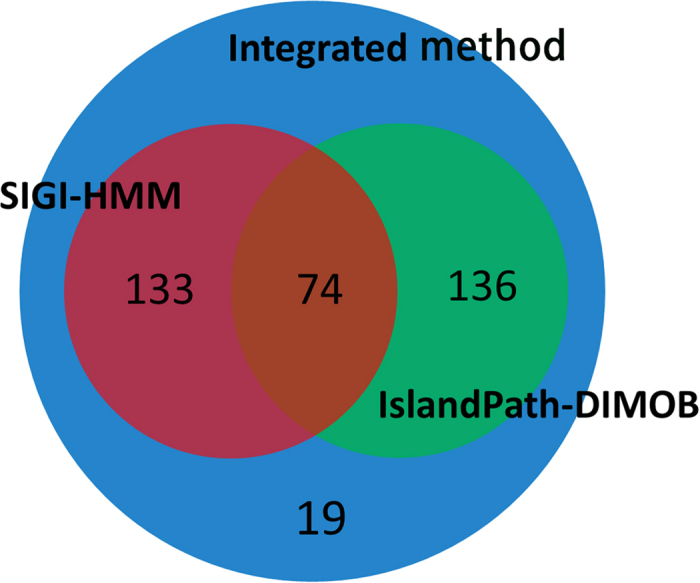
Figure 2. The Venn diagrams for the number distribution of essential genes located in GIs.

The three circles represent IslandPath-DIMOB, SIGI-HMM and Integrated method, respectively.

The three circles represent IslandPath-DIMOB, SIGI-HMM and Integrated method, respectively.