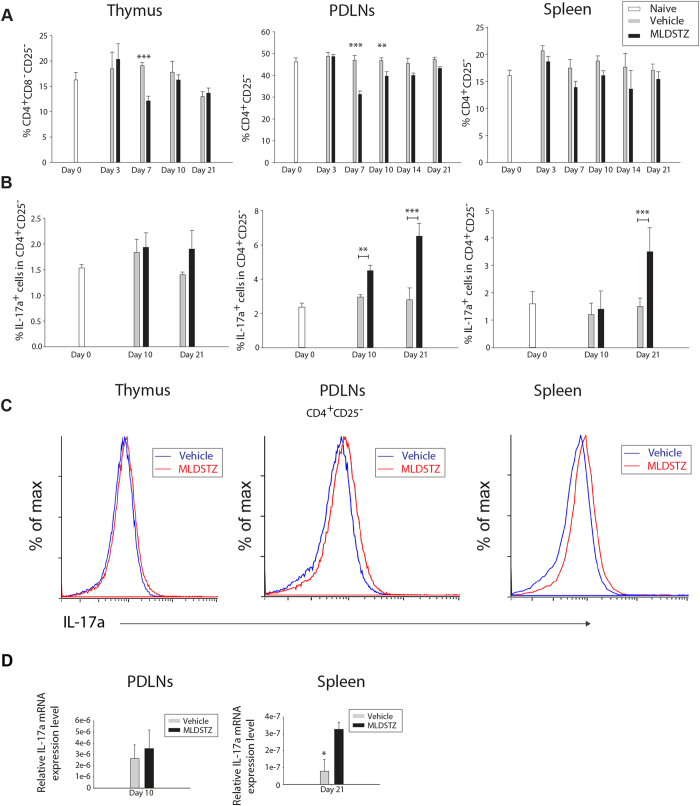
Figure 4. Increased numbers of tTreg and pTreg cells can not keep the numbers of Th17 cells down in MLDSTZ induced T1D.
(A) CD4+CD25− Th cells were analyzed by flow cytometry in thymic glands, PDLNs and spleen of vehicle and MLDSTZ injected mice. The proportions of CD4+CD25− Th cells in total was expressed as means ± SEM. All significant differences in PDLN cells are not indicated in the figure, but they are, however, described in the Results section. (B) The percentage of IL-17a+ T cells in CD4+CD25− Th cells were analyzed by flow cytometry in thymic glands, PDLNs and spleen of vehicle and MLDSTZ injected mice. (C) Representative histograms showing the expression of IL-17a in CD4+CD25− Th cells. (D) Relative IL-17a mRNA expression in PDLN cells (on day 10) and splenocytes (on day 21) of vehicle or MLDSTZ injected mice were analyzed by real time RT-PCR. Results are expressed as means ± SEM, from two experiments (n = 3 mice/group/experiment). Unpaired t-tests were performed for comparisons between vehicle and MLDSTZ treated groups on corresponding days. ** and *** denote p < 0.01, and p < 0.001, respectively.

